Asked by
Brett Bailey
on Nov 02, 2024
Verified
Which of these statistics best describes the relationship in this scatterplot? 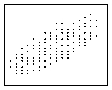
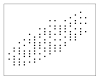
A) r = 1.00
B) r = .65
C) r = -.40
D) r = .00
Scatterplot
A graphical representation of data that displays values for typically two variables for a set of data.
- Ascertain the fitting statistical measures for illustrating the relationships between variables in scatterplots.

Verified Answer
KP

Learning Objectives
- Ascertain the fitting statistical measures for illustrating the relationships between variables in scatterplots.
Related questions
Which of These Statistics BEST Describes the Relationship in This ...
Which of These Statistics BEST Describes the Relationship in This ...
A)Linear Association,moderately Strong Association ...
A)Negative Association B)Moderately Strong Association ...
A Manager of a Supermarket Wishes to Show the Relationship ...