Asked by
Kaley Reindl
on Nov 02, 2024
Verified
Which of these statistics BEST describes the relationship in this scatterplot? 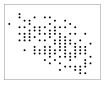
A) r = -1.00
B) r = .10
C) r = .50
D) r = -.45
Scatterplot
A type of graph used in statistics to display values for two variables for a set of data, showing how one variable is affected by another.
- Select the correct statistical tools to outline the connections among variables shown in scatterplots.

Verified Answer
PS

Learning Objectives
- Select the correct statistical tools to outline the connections among variables shown in scatterplots.
Related questions
Which of These Statistics Best Describes the Relationship in This ...
Which of These Statistics BEST Describes the Relationship in This ...
A)Linear Association,moderately Strong Association ...
A)Negative Association B)Moderately Strong Association ...
A Manager of a Supermarket Wishes to Show the Relationship ...