Asked by
Sukriti sareen
on Nov 02, 2024
Verified
Which of these statistics BEST describes the relationship in this scatterplot? 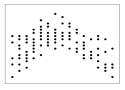
A) r = .00
B) r = .50
C) r = -.50
D) r = 1.00
Scatterplot
A scatterplot is a graphical representation using dots to show the relationship between two quantitative variables.
- Establish the appropriate statistical techniques to convey the relationships between variables presented in scatterplots.

Verified Answer
SS

Learning Objectives
- Establish the appropriate statistical techniques to convey the relationships between variables presented in scatterplots.
Related questions
Which of These Statistics BEST Describes the Relationship in This ...
Which of These Statistics Best Describes the Relationship in This ...
A)Linear Association,moderately Strong Association ...
A)Negative Association B)Moderately Strong Association ...
A Manager of a Supermarket Wishes to Show the Relationship ...