Asked by
Jennifer Fallin
on Oct 17, 2024
Verified
The histograms display the body fat percentages of 42 female students and 48 male students taking a college health course.For which of the variables depicted in the histograms would you be most satisfied to summarize the centre with a mean? Explain. 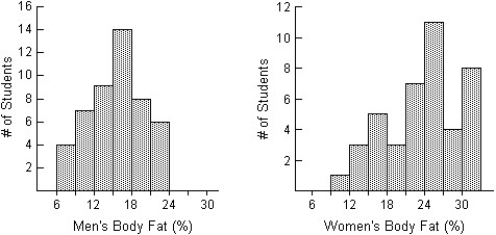
A) The histogram of Women's Body Fat is skewed on the left.That makes it the best candidate of summarizing with a mean.
B) The histogram of Women's Body Fat shows no outliers.That makes it the best candidate of summarizing with a mean.
C) The histogram of Men's Body Fat is most nearly symmetric,is not strongly skewed and shows no outliers.That makes it the best candidate of summarizing with a mean.
D) The histogram of Women's Body Fat is most nearly symmetric,is not strongly skewed and shows no outliers.That makes it the best candidate of summarizing with a mean.
E) The histogram of Men's Body Fat is skewed on the left.That makes it the best candidate of summarizing with a mean.
Histograms
Graphical representations of data that group numbers into ranges, showing the frequency of values within each range as bars.
Body Fat Percentages
A quantitative measure of the amount of fat in a person's body, expressed as a percentage of their total weight.
Mean
The average of a set of numbers, calculated by dividing the sum of all the numbers by the count of the numbers.
- Learn to delineate and explicate the form of distributions observed in histograms.
- Identify and justify the center of the distribution using mean or median based on skewness and outliers.

Verified Answer
VG

Learning Objectives
- Learn to delineate and explicate the form of distributions observed in histograms.
- Identify and justify the center of the distribution using mean or median based on skewness and outliers.
Related questions
A Small Company Employs a Supervisor at $1300 a Week,an ...
Office Workers Were Asked How Long It Took Them to ...
In a Histogram, the Proportion of the Total Area Which ...
Here Are Some Statistics for the Annual Wildcat Golf Tournament \(\text ...
The Speed Vehicles Travelled on a Local Road Was Recorded ...