Asked by
Mark John Santos
on Oct 24, 2024
Verified
A study is being conducted on air quality at a small college in the South.As part of this study,monitors were posted at every entrance to this college from 6:00 a.m.to 10:00 p.m.on a randomly chosen day.The monitors recorded the mode of transportation used by each person as they entered the campus.Based on the information recorded,the following bar graph was constructed. 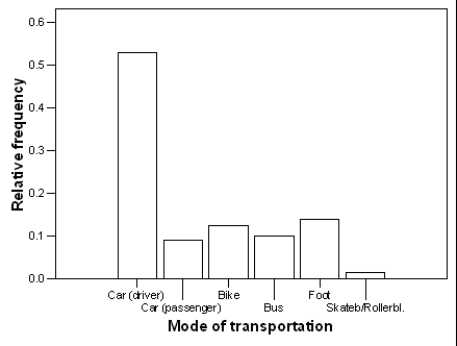 If 1200 people entered campus on this particular day, (approximately) how many people arrived by bus?
A) 10
B) 100
C) 120
D) 135
Air Quality
The condition of the air around us, often measured by the presence and concentration of various pollutants.
Mode Of Transportation
The means or type of movement of people or goods from one place to another, such as by car, train, airplane, or bicycle.
- Manifest an acquaintance with the underlying concepts necessary for the development of pie charts and bar graphs.
- Apply knowledge of data visualization to draw conclusions from graphical data.

Verified Answer
KW

Learning Objectives
- Manifest an acquaintance with the underlying concepts necessary for the development of pie charts and bar graphs.
- Apply knowledge of data visualization to draw conclusions from graphical data.
Related questions
When Using a Pie Chart,the Sum of All the Percentages ...
A Distributor of Electronics Is Doing a Customer Satisfaction Survey ...
The Pie Chart Provides Information on All the Majors at ...
Pie Charts Are an Effective Visual to Demonstrate a Procedure
Avoid the Use of Graphics in a Report Because Graphics ...