A) is zero because the U.S.is a closed economy.
B) is large because the United States imports a significant amount of foreign goods and services.
C) is large because the United States exports domestic products to every part of the world.
D) is small because the U.S.economy is too large to be significantly affected by foreign aggregate expenditures.
E) is small because U.S.foreign trade is not large enough to be counted as part of domestic GDP.
Correct Answer

verified
Correct Answer
verified
True/False
Wealth is considered to be a nonincome determinant of consumption.
Correct Answer

verified
Correct Answer
verified
Multiple Choice
The equilibrium level of income will rise when:
A) planned consumption spending is less than real GDP.
B) taxes exceed saving.
C) supply exceeds demand.
D) planned inventory investment is negative.
E) aggregate expenditures exceed real GDP.
Correct Answer

verified
Correct Answer
verified
Multiple Choice
The figure given below represents the leakages and injections in an economy. Figure 10.3 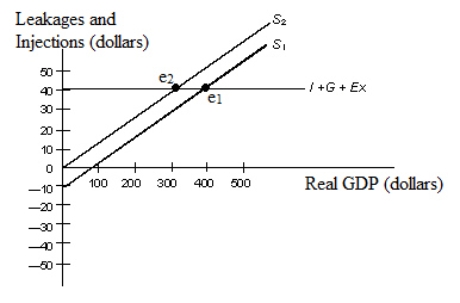 In the figure:
S1 and S2: Saving functions
I: Investment
G: Government spending
EX: Net exports
In Figure 10.3, which of the following represents the paradox of thrift?
A) A shift of the saving curve from S2 to S1.
B) A shift of the saving curve from S1 to S2.
C) A change in equilibrium from e2 to e1.
D) A change in equilibrium real GDP from $300 to $400.
E) A change in equilibrium real GDP from $100 to $400.
Correct Answer

verified
Correct Answer
verified
Multiple Choice
Consider a closed economy described by AE (aggregate expenditures) = 800, 000 + 0.75Y Assume that this economy is initially in equilibrium.But now the government implements a program to improve highways that will cost $1 million.This implies that equilibrium real GDP will:
A) decrease by $1 million.
B) decrease by $4 million.
C) increase by $1 million.
D) increase by $4 million.
E) decrease by $800, 000.
Correct Answer

verified
Correct Answer
verified
Multiple Choice
The figure given below depicts macroeconomic equilibrium in a closed economy.Assume that the spending multiplier in this economy is 1.5. Figure 10.5 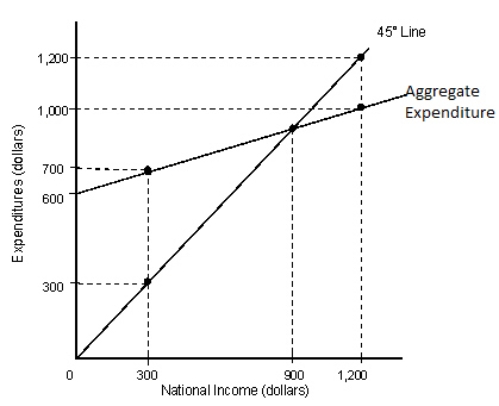 Refer to Figure 10.5.Assume that there is a recessionary gap that can be closed by a $500 increase in planned aggregate expenditures.If the economy is initially in equilibrium with a real GDP level of $900, then the target or potential level of real GDP must be:
A) $333.33.
B) $400.
C) $750.
D) $1, 400.
E) $1, 650.
Correct Answer

verified
Correct Answer
verified
Multiple Choice
The figure given below represents the leakages and injections of an economy. Figure 10.6 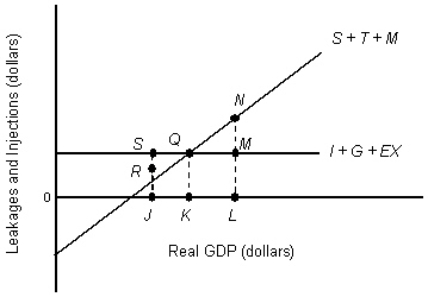 In Figure 10.6, the economy is in equilibrium at point _____.
A) S
B) Q
C) N
D) R
E) M
Correct Answer

verified
Correct Answer
verified
Multiple Choice
If aggregate expenditures are less than real GDP, then:
A) both inventories and real GDP will decline.
B) inventories will decline but real GDP will increase.
C) inventories will increase and real GDP will decline.
D) both inventories and real GDP will increase.
E) inventories will increase but real GDP will remain unchanged.
Correct Answer

verified
Correct Answer
verified
True/False
The Keynesian aggregate expenditures model assumes that price level is constant.
Correct Answer

verified
Correct Answer
verified
Multiple Choice
If 81 percent of Canada's exports go to the United States, a recession in the United States would probably:
A) lead to an economic boom in Canada.
B) have no impact on Canada's economy.
C) increase imports from Canada.
D) decrease Canada's domestic real GDP.
E) increase Canada's domestic real GDP.
Correct Answer

verified
Correct Answer
verified
Multiple Choice
The figure given below represents the leakages and injections in an economy. Figure 10.3 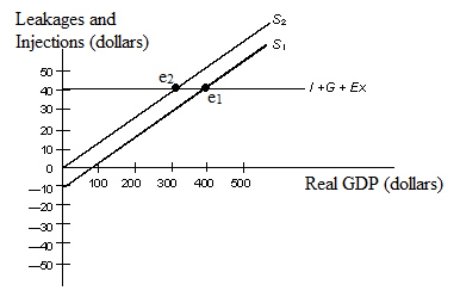 In the figure:
S1 and S2: Saving functions
I: Investment
G: Government spending
EX: Net exports
Refer to Figure 10.3.If saving is represented by S1, at a real GDP level of $500:
A) leakages are greater than injections which will cause income to increase.
B) leakages are greater than injections which will cause income to decrease.
C) leakages are less than injections which will cause income to increase.
D) leakages are less than injections which will cause income to decrease.
E) leakages are equal to injections which will cause no change in income.
Correct Answer

verified
Correct Answer
verified
Multiple Choice
The table given below reports the value of real GDP and its components consumption (C) , investment (I) , exports, and imports for two consecutive years. Table 10.3
 According to the information provided in Table 10.3, the MPI equals _____.
A) +0.12
B) -0.33
C) -0.21
D) +0.14
E) MPS
Correct Answer

verified
Correct Answer
verified
True/False
If total planned expenditures exceed real GDP, the economy will contract, causing production of goods and services to decrease and unplanned inventories to rise.
Correct Answer

verified
Correct Answer
verified
Multiple Choice
The figure given below shows the macroeconomic equilibrium of a country. Figure 10.7 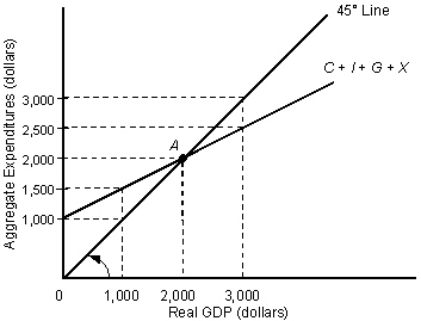 Given a potential GDP level of $3, 000, the recessionary gap in Figure 10.7 equals _____.
A) $3, 000
B) $2, 500
C) $1, 500
D) $500
E) $100
Correct Answer

verified
Correct Answer
verified
True/False
Other things equal, a reduction in personal income taxes will decrease consumption and will have an expansionary effect on real GDP.
Correct Answer

verified
Correct Answer
verified
Multiple Choice
If a country's imports are very important in determining the volume of exports from its trading partners, then:
A) the simple spending multiplier understates the true value of the multiplier.
B) the spending multiplier will equal 1/marginal propensity to import.
C) the simple spending multiplier is an accurate measure of the multiplier effect.
D) the simple spending multiplier will equal 1/MPC
E) the spending multiplier will equal 1/marginal propensity to save.
Correct Answer

verified
Correct Answer
verified
Multiple Choice
The table given below reports the value of real GDP and its components consumption (C) , investment (I) , exports, and imports for two consecutive years. Table 10.3
 Refer to Table 10.3.The change in investment spending from year 1 to year 2 is:
A) $1, 800.
B) $450.
C) $945.
D) $214.
E) $2, 100.
Correct Answer

verified
Correct Answer
verified
Multiple Choice
The figure given below represents the leakages and injections in an economy. Figure 10.2 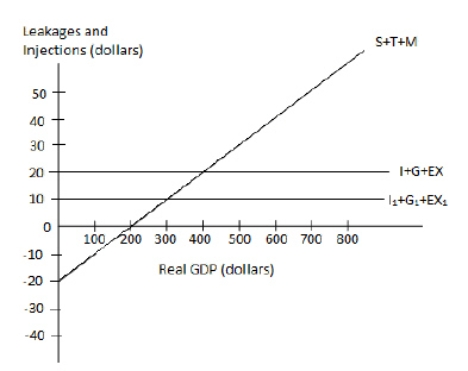 In the figure:
I, I1: Investment;
G: Government spending;
EX, EX1: Exports;
T: Taxes;and
M: Imports.
Refer to Figure 10.2.Suppose that I+G+EX equals $20 and the economy is in equilibrium.What is the amount of saving when T = $0 and M = $5 at the equilibrium level?
A) $0
B) $10
C) $15
D) $20
E) $25
Correct Answer

verified
Correct Answer
verified
True/False
The aggregate demand curve depicts a negative relationship between real GDP and the general price level.
Correct Answer

verified
Correct Answer
verified
Multiple Choice
Ceteris paribus, a downward shift in the net exports function will cause:
A) equilibrium real GDP to decrease.
B) equilibrium real GDP to increase.
C) savings to decrease.
D) net exports to increase.
E) government budget deficit to decline.
Correct Answer

verified
Correct Answer
verified
Showing 81 - 100 of 134
Related Exams