A) efficiency
B) equity
C) growth
D) stability
Correct Answer

verified
Correct Answer
verified
True/False
An efficient economy is one that produces what consumers demand and does so at the least possible cost.
Correct Answer

verified
Correct Answer
verified
Multiple Choice
You have noticed that there is an increase in the number of homeless people in your city.At the same time you observe that there are also a number of vacant apartments.You believe that the government could reduce the number of homeless people if landlords were required to rent their apartments for less than they are currently charging.This policy recommendation would be motivated by concerns over
A) efficiency.
B) equity.
C) economic growth.
D) stability.
Correct Answer

verified
Correct Answer
verified
Multiple Choice
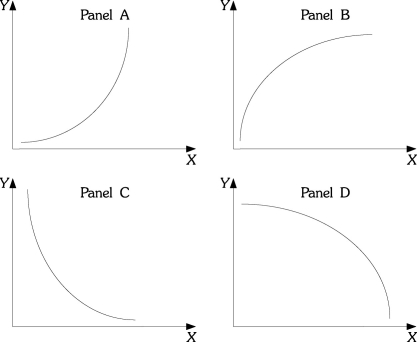
Refer to the information provided in Figure 1.5 below to answer the questions that follow.
 Figure 1.5
-Refer to Figure 1.5.Which of the curves has a slope that is positive and decreasing?
A) A
B) B
C) C
D) D
Correct Answer

verified
Correct Answer
verified
Multiple Choice
The rise of the modern factory system in England during the late eighteenth and early nineteenth centuries is known as the
A) Great Migration.
B) Industrial Revolution.
C) Wealth of Nations.
D) Dark Ages.
Correct Answer

verified
Correct Answer
verified
Multiple Choice
Experimental research in small cities suggests that mandating work for welfare recipients increases their income.Therefore,we should mandate work requirements for all welfare recipients.This statement is an example of
A) fallacy of inductive reasoning.
B) ceteris paribus fallacy.
C) fallacy of composition.
D) post hoc,ergo propter hoc fallacy.
Correct Answer

verified
Correct Answer
verified
Multiple Choice
A government policy that tries to minimize inflation and unemployment can best be described as trying to achieve economic
A) efficiency.
B) equity.
C) profitability.
D) stability.
Correct Answer

verified
Correct Answer
verified
Multiple Choice
Related to the Economics in Practice on p.10: Prior to joining a fraternity,James spent most of his evenings and weekends studying for his classes.Once he joined the fraternity,James spent a majority of his evenings and weekends going to parties.This change in behavior is best described by
A) the fallacy of composition.
B) the post hoc ergo propter hoc fallacy.
C) the problem of causality.
D) the ceteris paribus error.
Correct Answer

verified
Correct Answer
verified
Multiple Choice
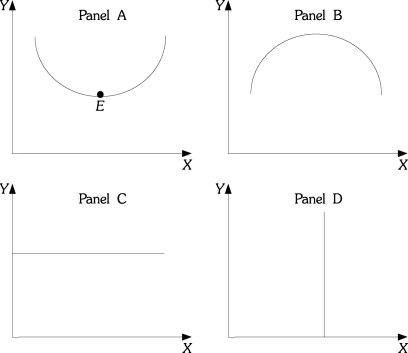
Refer to the information provided in Figure 1.4 below to answer the questions that follow.
 Figure 1.4
-Refer to Figure 1.4.Which of the curves or lines has an infinite slope throughout?
A) A
B) B
C) C
D) D
Correct Answer

verified
Correct Answer
verified
Multiple Choice
Which of the following is NOT one of the three fundamental concepts of economics?
A) profit maximization
B) marginalism
C) opportunity cost
D) the working of efficient markets
Correct Answer

verified
Correct Answer
verified
Multiple Choice
An efficient economy is an economy
A) in which output is steady or growing and there is low inflation.
B) that produces what consumers demand and does so at the least possible cost.
C) that distributes output equally among all consumers.
D) in which there is a fair distribution of wealth.
Correct Answer

verified
Correct Answer
verified
Multiple Choice
The cost involved when choosing between alternatives is known as the
A) marginal cost.
B) sunk cost.
C) opportunity cost.
D) normative cost.
Correct Answer

verified
Correct Answer
verified
Multiple Choice
Which of the following statements is NOT correct?
A) Economics is a behavioral science.
B) In large measure,economics is the study of how people make choices.
C) If poverty were eliminated,there would be no reason to study economics.
D) Economic analysis can be used to explain how both individuals and societies make decisions.
Correct Answer

verified
Correct Answer
verified
Multiple Choice
Refer to the information provided in Figure 1.5 below to answer the questions that follow.
 Figure 1.5
-Refer to Figure 1.5.In many industries,as firms produce additional units,average costs of production decline as the firm produces an additional unit,but average costs declines by a smaller and smaller amount as production continues to increase.If output is graphed on the horizontal axis and average costs are graphed on the vertical axis,the relationship between average costs and output would be like which of the following panels?
A) A
B) B
C) C
D) D
Correct Answer

verified
Correct Answer
verified
Multiple Choice
Suppose that you purchased a ticket to a jazz festival for $100 from an online ticket broker.Once you arrived at the festival,you discovered that parking costs you an additional $15.In this situation,the additional $15 you pay for parking is an example of
A) an economic loss.
B) opportunity cost.
C) marginal cost.
D) an inefficient cost.
Correct Answer

verified
Correct Answer
verified
Multiple Choice
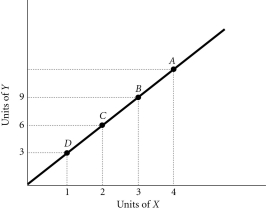
Refer to the information provided in Figure 1.3 below to answer the questions that follow.
 Figure 1.3
-Refer to Figure 1.3.The slope of the line is
A) positive.
B) negative.
C) increasing at an increasing rate.
D) decreasing at an increasing rate.
Correct Answer

verified
Correct Answer
verified
Multiple Choice
Refer to the information provided in Figure 1.4 below to answer the questions that follow.
 Figure 1.4
-Refer to Figure 1.4.Which of the following curves or lines has a zero slope throughout?
A) A
B) B
C) C
D) D
Correct Answer

verified
Correct Answer
verified
Multiple Choice
Refer to the information provided in Figure 1.4 below to answer the questions that follow.
 Figure 1.4
-Refer to Figure 1.4.At Point E in panel A,the slope is
A) zero.
B) infinite.
C) negative.
D) indeterminate from this information.
Correct Answer

verified
Correct Answer
verified
Multiple Choice
Refer to the information provided in Figure 1.3 below to answer the questions that follow.
 Figure 1.3
-Refer to Figure 1.3.At Point A the slope of the line is 3,so at Point D the slope would be
A) greater than 3.
B) less than 3.
C) equal to 3.
D) indeterminate from this information.
Correct Answer

verified
Correct Answer
verified
Multiple Choice
Refer to Scenario 1.1 below to answer the questions that follow. SCENARIO 1.1: An economist wants to understand the relationship between minimum wages and the level of teenage unemployment.The economist collects data on the values of the minimum wage and the levels of teenage unemployment over time.The economist concludes that a 1% increase in minimum wage causes a 0.2% increase in teenage unemployment.From this information he concludes that the minimum wage is harmful to teenagers and should be reduced or eliminated to increase employment among teenagers. -Refer to Scenario 1.1.The statement that an increase in the minimum wage causes an increase in teenage unemployment is an example of
A) a fallacy.
B) an economic theory.
C) normative economics.
D) deductive reasoning.
Correct Answer

verified
Correct Answer
verified
Showing 81 - 100 of 120
Related Exams