A) $2,000.
B) $5,000.
C) $8,000.
D) $16,000.
Correct Answer

verified
Correct Answer
verified
Multiple Choice
Figure 8-12 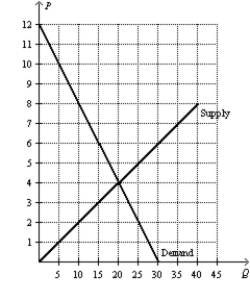 -Refer to Figure 8-12.Suppose a $3 per-unit tax is placed on this good.The tax causes the price received by sellers to
A) decrease by $3.
B) increase by $2.
C) decrease by $1.
D) increase by $6.
Correct Answer

verified
Correct Answer
verified
Multiple Choice
If a tax shifts the demand curve downward (or to the left) ,we can infer that the tax was levied on
A) buyers of the good.
B) sellers of the good.
C) both buyers and sellers of the good.
D) We cannot infer anything because the shift described is not consistent with a tax.
Correct Answer

verified
Correct Answer
verified
Multiple Choice
Scenario 8-1 Erin would be willing to pay as much as $100 per week to have her house cleaned.Ernesto's opportunity cost of cleaning Erin's house is $70 per week. -Refer to Scenario 8-1.If Ernesto cleans Erin's house for $90,Ernesto's producer surplus is
A) $80.
B) $30.
C) $20.
D) $10.
Correct Answer

verified
Correct Answer
verified
Multiple Choice
Figure 8-8
Suppose the government imposes a $10 per unit tax on a good. 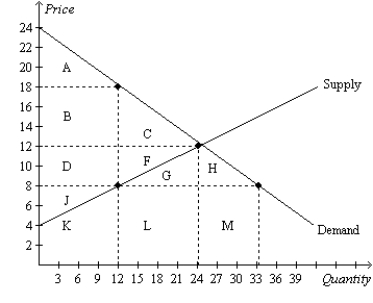 -Refer to Figure 8-8.The government collects tax revenue that is the area
A) L.
B) B+D.
C) C+F.
D) F+G+L.
Correct Answer

verified
Correct Answer
verified
Multiple Choice
Figure 8-6
The vertical distance between points A and B represents a tax in the market. 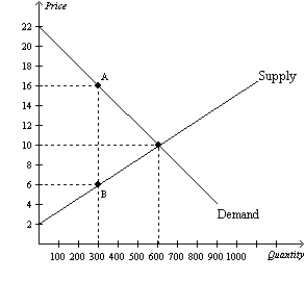 -Refer to Figure 8-6.When the tax is imposed in this market,producer surplus is
A) $450.
B) $600.
C) $900.
D) $1,500.
Correct Answer

verified
Correct Answer
verified
Multiple Choice
The supply curve for motor oil is the typical upward-sloping straight line,and the demand curve for motor oil is the typical downward-sloping straight line.When motor oil is taxed,the area on the relevant supply-and-demand graph that represents the deadweight loss is
A) larger than the area that represents consumer surplus in the absence of the tax.
B) larger than the area that represents government's tax revenue.
C) a triangle.
D) All of the above are correct.
Correct Answer

verified
Correct Answer
verified
Multiple Choice
In the market for widgets,the supply curve is the typical upward-sloping straight line,and the demand curve is the typical downward-sloping straight line.The equilibrium quantity in the market for widgets is 250 per month when there is no tax.Then a tax of $6 per widget is imposed.As a result,the government is able to raise $750 per month in tax revenue.We can conclude that the after-tax quantity of widgets is
A) 75 per month.
B) 100 per month.
C) 125 per month.
D) 150 per month.
Correct Answer

verified
Correct Answer
verified
Multiple Choice
The benefit to buyers of participating in a market is measured by
A) consumer surplus.
B) producer surplus.
C) total surplus.
D) deadweight loss.
Correct Answer

verified
Correct Answer
verified
Multiple Choice
Figure 8-4
The vertical distance between points A and B represents a tax in the market. 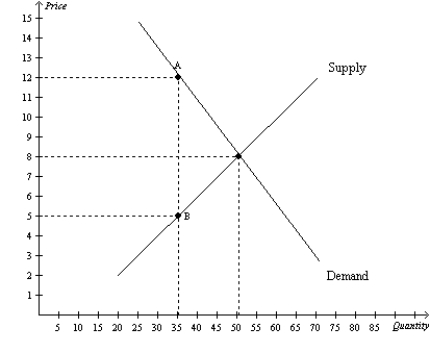 -Refer to Figure 8-4.The per-unit burden of the tax on buyers is
A) $3.
B) $4.
C) $5.
D) $8.
Correct Answer

verified
Correct Answer
verified
Multiple Choice
Figure 8-10 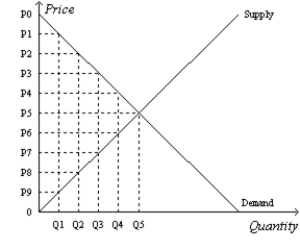 -Refer to Figure 8-10.Suppose the government imposes a tax that reduces the quantity sold in the market after the tax to Q2.With the tax,the consumer surplus is
A) (P0-P2) x Q2.
B) 1/2 x (P0-P2) x Q2.
C) (P0-P5) x Q5.
D) 1/2 x (P0-P5) x Q5.
Correct Answer

verified
Correct Answer
verified
Multiple Choice
Figure 8-8
Suppose the government imposes a $10 per unit tax on a good.  -Refer to Figure 8-8.The tax causes producer surplus to decrease by the area
A) D+F.
B) D+F+G.
C) D+F+J.
D) D+F+G+H.
Correct Answer

verified
Correct Answer
verified
Multiple Choice
Figure 8-6
The vertical distance between points A and B represents a tax in the market.  -Refer to Figure 8-6.When the tax is imposed in this market,the price buyers effectively pay is
A) $4.
B) $6.
C) $10.
D) $16.
Correct Answer

verified
Correct Answer
verified
Multiple Choice
To measure the gains and losses from a tax on a good,economists use the tools of
A) macroeconomics.
B) welfare economics.
C) international-trade theory.
D) circular-flow analysis.
Correct Answer

verified
Correct Answer
verified
Multiple Choice
A tax of $0.25 is imposed on each bag of potato chips that is sold.The tax decreases producer surplus by $600 per day,generates tax revenue of $1,220 per day,and decreases the equilibrium quantity of potato chips by 120 bags per day.The tax
A) decreases consumer surplus by $645 per day.
B) decreases the equilibrium quantity from 6,000 bags per day to 5,880 bags per day.
C) decreases total surplus from $3,000 to $1,800 per day.
D) creates a deadweight loss of $15 per day.
Correct Answer

verified
Correct Answer
verified
Multiple Choice
Figure 8-2
The vertical distance between points A and B represents a tax in the market. 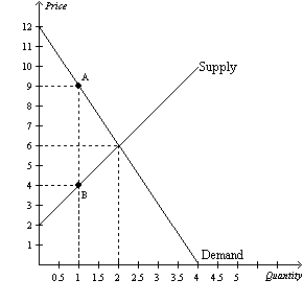 -Refer to Figure 8-2.The loss of consumer surplus as a result of the tax is
A) $1.50.
B) $3.
C) $4.50.
D) $6.
Correct Answer

verified
Correct Answer
verified
Multiple Choice
Figure 8-3
The vertical distance between points A and C represents a tax in the market.  -Refer to Figure 8-3.The amount of deadweight loss associated with the tax is equal to
A) P3ACP1.
B) ABC.
C) P2ADP3.
D) P1DCP2.
Correct Answer

verified
Correct Answer
verified
Multiple Choice
Suppose a tax of $3 is imposed on each new garden hose that is sold,resulting in a deadweight loss of $22,500.The supply curve is a typical upward-sloping straight line,and the demand curve is a typical downward-sloping straight line.Before the tax was imposed,the equilibrium quantity of garden hoses was 100,000.We can conclude that the equilibrium quantity of garden hoses after the tax is imposed is
A) 75,000.
B) 85,000.
C) 90,000.
D) 95,000.
Correct Answer

verified
Correct Answer
verified
Multiple Choice
Figure 8-4
The vertical distance between points A and B represents a tax in the market.  -Refer to Figure 8-4.The tax results in a loss of consumer surplus that amounts to
A) $105.
B) $140.
C) $170.
D) $210.
Correct Answer

verified
Correct Answer
verified
Multiple Choice
Figure 8-1 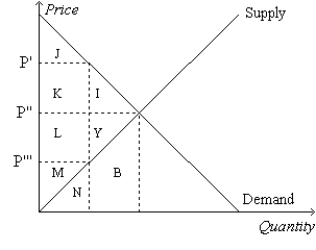 -Refer to Figure 8-1.Suppose the government imposes a tax of P' - P'''.The area measured by J represents
A) consumer surplus after the tax.
B) consumer surplus before the tax.
C) producer surplus after the tax.
D) producer surplus before the tax.
Correct Answer

verified
Correct Answer
verified
Showing 141 - 160 of 247
Related Exams