A) producer price index
B) consumer price index
C) GDP deflator
D) national income account
Correct Answer

verified
Correct Answer
verified
True/False
The base period for the consumer price index is 1982-1984.
Correct Answer

verified
Correct Answer
verified
Multiple Choice
Use the following to answer questions :
Table: The Consumer Price Index 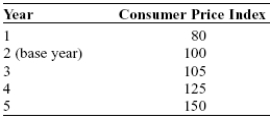 -(Table: The Consumer Price Index) Look at the table The Consumer Price Index. The approximate rate of inflation in year 2 is:
A) 10%.
B) 19%.
C) 20%.
D) 25%.
Correct Answer

verified
Correct Answer
verified
True/False
The total value of all final goods and services produced in the economy in a given year, calculated with the prices current in the year in which the output is produced, is real GDP.
Correct Answer

verified
Correct Answer
verified
Multiple Choice
Use the following to answer questions :
Table: Price and Output Data 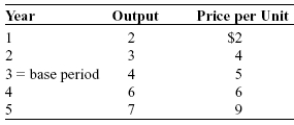 -(Table: Price and Output Data) Look at the table Price and Output Data. Between years 4 and 5, nominal GDP increased by:
A) 33%.
B) 75%.
C) 50%.
D) 13%.
Correct Answer

verified
Correct Answer
verified
Multiple Choice
If real GDP falls while nominal GDP rises, then prices on average have:
A) risen.
B) fallen.
C) stayed the same.
D) Real GDP cannot rise when nominal GDP falls.
Correct Answer

verified
Correct Answer
verified
Multiple Choice
Use the following to answer questions :
Table: Price and Output Data  -(Table: Price and Output Data) Look at the table Price and Output Data. Nominal GDP in year 5 is:
A) $1.29.
B) $16.
C) $45.
D) $63.
Correct Answer

verified
Correct Answer
verified
Multiple Choice
Use the following to answer questions :
Table: Lemonade and Cookies
 -(Table: Lemonade and Cookies) Look at the table Lemonade and Cookies. Assume that an economy produces only lemonade and cookies. Nominal GDP in 2013 was:
A) $400.
B) $420.
C) $445.
D) $820.
Correct Answer

verified
Correct Answer
verified
Multiple Choice
Which of the following is FALSE? Gross domestic product:
A) is aggregate output.
B) is the total production of final goods and services.
C) grows during an expansion.
D) is the total production of all final and intermediate goods and services.
Correct Answer

verified
Correct Answer
verified
Multiple Choice
The Arcadia Entertainment Co. produced 20,000 DVDs of the movie Thor in 2011. Only 4,000 copies remained unsold at the end of 2011. As a result:
A) only 16,000 DVDs should be included in GDP in 2011 as consumption expenditure.
B) all 20,000 DVDs will be included in GDP in 2011, 16,000 as consumption expenditure and 4,000 as investment expenditure
C) only 16,000 DVDs are included in GDP of 2011; the remaining 4,000 are counted in GDP of 2012.
D) all 20,000 DVDs are initially counted in 2011 GDP as consumption expenditure, but they will be subtracted and added to 2012 GDP as the merchandise gets sold.
Correct Answer

verified
Correct Answer
verified
Multiple Choice
Use the following to answer questions :
Scenario: Good A and Good B
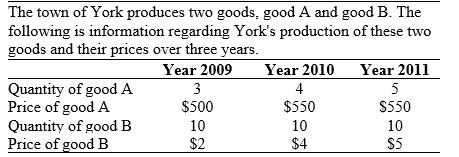 -(Scenario: Good A and Good B) Look at the Scenario Good A and Good B. With 2009 as the base year, real GDP in 2009 was _____ GDP in _____.
A) equal to real; 2010
B) equal to nominal; 2009
C) greater than real; 2010
D) greater than nominal; 2011
Correct Answer

verified
Correct Answer
verified
True/False
The underlying principle of the circular-flow diagram is that the flows of money into each sector or market in the economy are equal to those coming out of the sector or market.
Correct Answer

verified
Correct Answer
verified
Multiple Choice
Use the following to answer questions :
Table: Price and Output Data  -(Table: Price and Output Data) Look at the table Price and Output Data. The value of year 4's output in real dollars is:
A) $5.20.
B) $6.
C) $30.
D) $36.
Correct Answer

verified
Correct Answer
verified
True/False
The consumer price index measures the cost of the consumption of a family of four living below the poverty line.
Correct Answer

verified
Correct Answer
verified
Multiple Choice
Use the following to answer questions:
Table: Real and Nominal Output 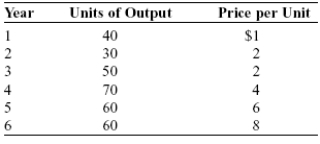 -(Table: Real and Nominal Output) Look at the table Real and Nominal Output. Nominal GDP in year 4 is equal to:
A) $40.
B) $60.
C) $100.
D) $280.
Correct Answer

verified
Correct Answer
verified
Multiple Choice
Spending on inputs is _____ of GDP, and investment spending is _____ of GDP.
A) part; part
B) not a part; part
C) part; not a part
D) not a part; not a part
Correct Answer

verified
Correct Answer
verified
Multiple Choice
If the cost of the market basket in the base year is $2,000 and in 2014 it is $2,100, the price index for 2014 is:
A) 2,100.
B) 105.
C) 100.
D) 95.
Correct Answer

verified
Correct Answer
verified
Multiple Choice
In 2011, consumption spending is $7,000, government purchases of goods and services is $2,000, and investment spending is $1,500. If GDP for 2011 is $10,300, exports are _____ and imports are _____.
A) $400; $200
B) $100; $200
C) $600; $800
D) $500; $300
Correct Answer

verified
Correct Answer
verified
Multiple Choice
Use the following to answer questions:
Figure: Expanded Circular-Flow Model 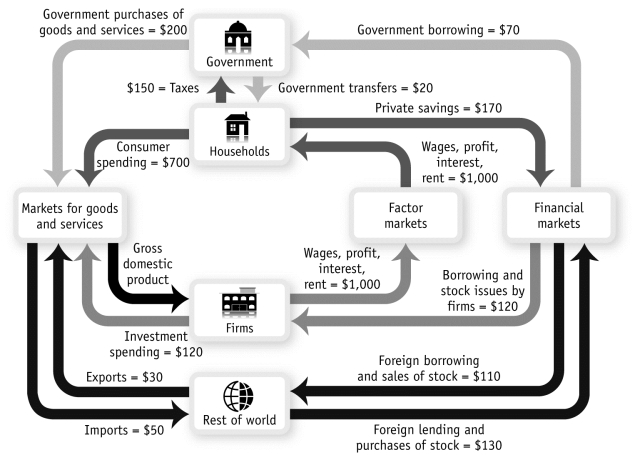 -(Figure: Expanded Circular-Flow Model) Look at the figure Expanded Circular-Flow Model. How does the government finance its spending?
A) taxes of $150 plus borrowing of $70
B) foreign borrowing and sales of stock of $110
C) investment spending of $120
D) net exports of $80
Correct Answer

verified
Correct Answer
verified
Multiple Choice
Use the following to answer questions :
Table: Pizza Economy III
 -(Table: Pizza Economy III) Look at the table Pizza Economy III. Considering 2010 as the base year, given that total population was 1,140 in 2010 and 1,300 in 2011, real GDP per capita in 2010 was:
A) $80.
B) $53.
C) $60.
D) $100.
Correct Answer

verified
Correct Answer
verified
Showing 21 - 40 of 434
Related Exams