A) increase the supply of the good.
B) decrease the supply of the good
C) increase quantity supplied of the good.
D) decrease quantity supplied of the good.
E) increase the slope of the supply curve of the good.
Correct Answer

verified
Correct Answer
verified
True/False
Ceteris paribus, an increase in the equilibrium price and the equilibrium quantity would be caused by an increase in supply
Correct Answer

verified
Correct Answer
verified
Multiple Choice
Table 3-2 shows a market of mid-sized autos. If these three firms represented the entire market, how many mid-sized autos would be supplied at a price of $30,000?Table 3-2 
A) 43,000
B) 54,000
C) 126,000
D) 158,000
E) 22,000
Correct Answer

verified
Correct Answer
verified
Multiple Choice
Table 3-4 shows the market demand and market supply schedules for music downloads. The equilibrium price of music downloads is: 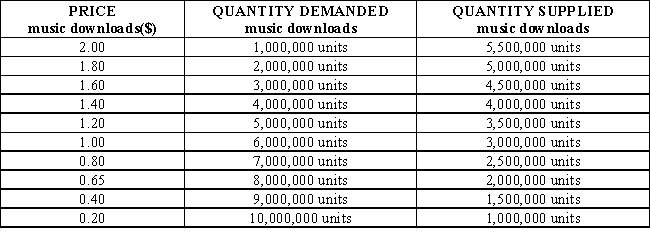
A) $0.80.
B) $1.00.
C) $1.20.
D) $1.40.
E) $1.60
Correct Answer

verified
Correct Answer
verified
Multiple Choice
Figure 3-3 shows shifts in the supply curve of a good. A change from Point A to Point C represents a(n) :Figure 3-3 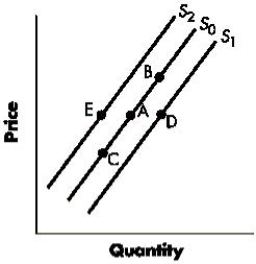
A) increase in the supply of the good.
B) decrease in the supply of the good.
C) increase in the quantity supplied of the good.
D) decrease in the quantity supplied of the good.
E) increase in the price of the good.
Correct Answer

verified
Correct Answer
verified
True/False
Incorrect. If the demand for a good increases when incomes rise and decreases when incomes fall, the good is called a normal good. See 3-2: Demand
Correct Answer

verified
Correct Answer
verified
Multiple Choice
Figure 3-4 represents the market for butter. If the current price of butter equals $2 per pound, then:Figure 3-4 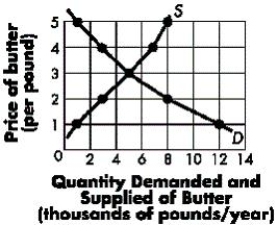
A) the market is in equilibrium at 3,000 pounds per year.
B) the market is in equilibrium at 8,000 pounds per year.
C) the market is not in equilibrium and the quantity supplied is greater than the quantity demanded.
D) the market is not in equilibrium and the quantity demanded is greater than the quantity supplied.
E) the market is in equilibrium at 6,000 pounds of butter per year.
Correct Answer

verified
Correct Answer
verified
Multiple Choice
When there is an excess quantity demanded for a product at the current price, then:
A) the price will tend to fall
B) the price will tend to rise.
C) the price must be above the equilibrium price.
D) producers will reduce output and sales will fall.
E) the quantity demanded will tend to fall.
Correct Answer

verified
Correct Answer
verified
Multiple Choice
Which of the following is true of a competitive market?
A) The rules of supply and demand do not apply to it.
B) Sellers have little market power.
C) The largest firm is the price maker.
D) Few sellers offer similar products.
E) Government plays an important role in a competitive market.
Correct Answer

verified
Correct Answer
verified
True/False
Ceteris paribus, if the price of lumber increases, we would expect an increase in the supply of lumber.
Correct Answer

verified
Correct Answer
verified
Multiple Choice
The law of demand states that, ceteris paribus, an increase in:
A) the price of a good causes its quantity demanded to increase.
B) the price of a good causes its quantity demanded to decrease.
C) the quantity demanded of a good causes its price to increase.
D) the quantity demanded of a good causes its price to decrease.
E) the quantity demanded of a good causes its supply to decrease.
Correct Answer

verified
Correct Answer
verified
Multiple Choice
If the decrease in the supply of a product is greater than the increase in its demand, _____.
A) the price will rise, but the quantity traded will fall
B) the price will rise, but the quantity traded could either rise or fall
C) the price will fall, but the quantity traded could either rise or fall
D) the quantity traded will rise, but the price could either rise or fall
E) the price will remain the same, but the quantity traded will fall
Correct Answer

verified
Correct Answer
verified
Multiple Choice
An increase in quantity demanded:
A) is illustrated by a movement downward and to the right along a demand curve.
B) is illustrated by a movement upward and to the left along a demand curve.
C) is illustrated by a movement upward and to the left along a demand curve..
D) is illustrated by a movement upward and to the left along a demand curve
E) changes the slope of the demand curve.
Correct Answer

verified
Correct Answer
verified
Multiple Choice
If both the supply and demand curves shift to the left, there will be a(n) :
A) increase in the equilibrium quantity sold.
B) decrease in the equilibrium quantity sold.
C) increase in the equilibrium price.
D) decrease in the equilibrium price.
E) a change in quantity that is indeterminate.
Correct Answer

verified
Correct Answer
verified
Multiple Choice
Figure 3-4 represents the market for butter. The equilibrium price of butter is: 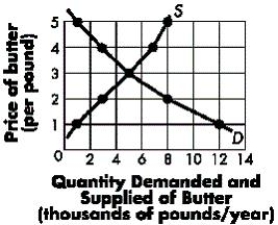
A) $5 per pound.
B) $3 per pound.
C) $2 per pound.
D) $1 per pound.
E) $4 per pound.
Correct Answer

verified
Correct Answer
verified
Multiple Choice
Table 3-3 shows the market demand and market supply schedules for large pepperoni pizzas. At a price of $4, there is a _____ of _____ pizzas. 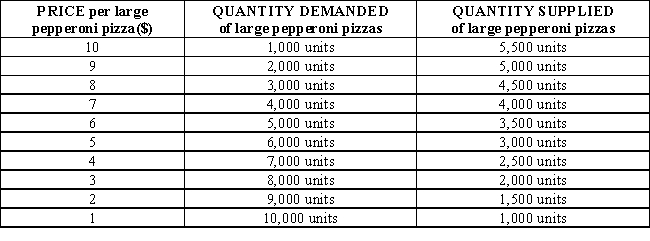
A) shortage; 4,500
B) surplus; 4,500
C) shortage; 6,500
D) surplus; 6,500
E) shortage; 3,000
Correct Answer

verified
Correct Answer
verified
True/False
According to the law of supply, other things equal, when the price of a good or service rises, the quantity supplied increases, but supply does not
Correct Answer

verified
Correct Answer
verified
Multiple Choice
A decrease in the number of sellers in the market for a good causes:
A) the supply curve of the good to shift to the left.
B) the supply curve of the good to shift to the right.
C) a movement up and to the right along a stationary supply curve of the good.
D) a movement downward and to the left along a stationary supply curve of the good.
E) a change in the slope of the supply curve of the good.
Correct Answer

verified
Correct Answer
verified
Multiple Choice
Figure 3-3 shows shifts in the supply curve of a good. A change from Point A to Point D represents a(n) ;Figure 3-3 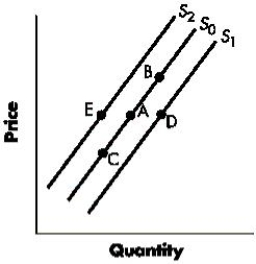
A) increase in the supply of the good.
B) decrease in the supply of the good
C) increase in the quantity supplied of the good
D) decrease in the quantity supplied of the good.
E) decrease in the price of the good
Correct Answer

verified
Correct Answer
verified
Showing 81 - 99 of 99
Related Exams