Correct Answer

verified
Correct Answer
verified
True/False
Percentiles divide a distribution into 100 equal parts.
Correct Answer

verified
Correct Answer
verified
True/False
In a stem-and-leaf display, the leaf represents the members of a class in a frequency distribution.
Correct Answer

verified
Correct Answer
verified
Multiple Choice
The following graph is a: 
A) Dot plot
B) Stem-and-leaf display
C) Box plot
D) Contingency table
Correct Answer

verified
Correct Answer
verified
Multiple Choice
A dot plot can be used to show _________________.
A) The mean, median, and mode
B) The general shape of a distribution for a nominal qualitative variable
C) The distribution for a quantitative variable
D) The interquartile range
Correct Answer

verified
Correct Answer
verified
Multiple Choice
Which of the following is not a measure of dispersion?
A) The interquartile range
B) The standard deviation
C) The 50th percentile
D) The range
Correct Answer

verified
Correct Answer
verified
True/False
A dot plot is useful for showing individual observations.
Correct Answer

verified
Correct Answer
verified
Essay
A telemarketing firm is monitoring the performance of its employees based on the number of sales per hour. One employee had the following sales for the last 19 hours.  For the distribution of number of sales per hour, 50% are equal or greater than ___________.
Correct Answer

verified
the median or 5 sales per hour...View Answer
Show Answer
Correct Answer
verified
View Answer
Multiple Choice
The eighth decile:
A) contains at least 70 percent of the observations.
B) is the same as the 40th percentile.
C) is the same as the 70th percentile.
D) is the same as the 80th percentile.
Correct Answer

verified
Correct Answer
verified
Multiple Choice
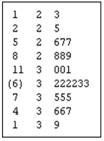
The following table is a: 
A) Dot plot
B) Stem-and-leaf display
C) Box plot
D) Contingency table
Correct Answer

verified
Correct Answer
verified
Multiple Choice
The following graph is _______________. 
A) Positively skewed
B) Negatively skewed
C) Symmetric
D) Uniformly distributed
Correct Answer

verified
Correct Answer
verified
Multiple Choice
The interquartile range is graphically presented in a ___________.
A) Dot plot
B) Stem-and-leaf display
C) Box plot
D) Contingency table
Correct Answer

verified
Correct Answer
verified
Multiple Choice
In the following table, 
A) The median is 2.5.
B) The minimum value is 135.
C) The maximum value is 456.
D) The range is 33.
Correct Answer

verified
Correct Answer
verified
Multiple Choice
A stem-and-leaf display includes the following row: 3 | 0 1 3 5 7 9. Assume that the data is rounded to the nearest whole number. Which of the following statements is true?
A) The frequency of the class is seven.
B) The minimum value in the class is 0.
C) The maximum value in the class is 39.
D) The class interval is 5.
Correct Answer

verified
Correct Answer
verified
Multiple Choice
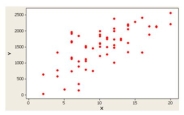
The following graph is a ___________. 
A) Dot plot
B) Stem-and-leaf display
C) Box plot
D) Scatter plot
Correct Answer

verified
Correct Answer
verified
Short Answer
The coefficient of skewness measures a distribution's ____________ symmetry.
Correct Answer

verified
Correct Answer
verified
Short Answer
The ______________ is used to measure the relative symmetry of a distribution.
Correct Answer

verified
coefficien...View Answer
Show Answer
Correct Answer
verified
View Answer
Multiple Choice
Outliers are clearly presented in a _____________.
A) Dot plot
B) Stem-and-leaf display
C) Box plot
D) Contingency table
Correct Answer

verified
Correct Answer
verified
Multiple Choice
In a distribution, the second quartile corresponds with the __________.
A) Mean
B) Median
C) Mode
D) Variance
Correct Answer

verified
Correct Answer
verified
True/False
A stem-and-leaf diagram shows the actual data values.
Correct Answer

verified
Correct Answer
verified
Showing 81 - 100 of 113
Related Exams