A) marginal costs are constant as output increases.
B) long-run average total costs are decreasing as output increases.
C) long-run average total costs are increasing as output increases.
D) marginal costs are equal to average total costs for all levels of output.
Correct Answer

verified
B
Correct Answer
verified
Multiple Choice
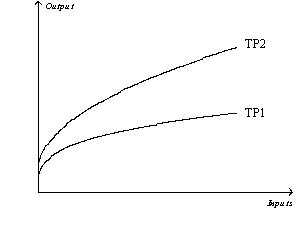
Figure 13-1  -Refer to Figure 13-1.Suppose the production function shifts from TP2 to TP1.Such a shift in the total product curve is most likely due to a decrease in the firm's
A) costs of production.
B) product price.
C) market share.
D) productivity.
Correct Answer

verified
Correct Answer
verified
Multiple Choice
Scenario 13-7 Wanda owns a lemonade stand.She produces lemonade using five inputs: water,sugar,lemons,paper cups,and labor.Her costs per glass are as follows: 0.01 dinar for water,0.02 dinar for sugar,0.03 dinar for lemons,0.02 dinar for cups,and 0.10 dinar for the opportunity cost of her labor.She can sell 300 glasses for 0.50 dinar each. -Refer to Scenario 13-7.What are Wanda's implicit costs per glass?
A) 0.18
B) 0.10
C) 0.08
D) 0.02
Correct Answer

verified
Correct Answer
verified
Multiple Choice
The amount of money that a firm pays to buy inputs is called
A) total cost.
B) variable cost.
C) marginal cost.
D) fixed cost.
Correct Answer

verified
Correct Answer
verified
Multiple Choice
Thirsty Thelma owns and operates a small lemonade stand.When Thelma is producing a low quantity of lemonade she has few workers and her equipment is not being fully utilized.Because she can easily put her idle resources to use,
A) the marginal cost of an extra worker is large.
B) the marginal cost of one more glass of lemonade is smaller than if output were high.
C) the marginal product of an extra worker is small.
D) her lemonade stand is likely to be crowded with workers.
Correct Answer

verified
Correct Answer
verified
Multiple Choice
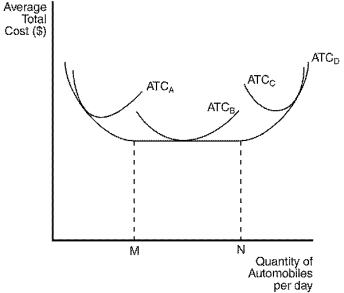
Figure 13-9
The figure below depicts average total cost functions for a firm that produces automobiles.  -Refer to Figure 13-9.This firm experiences diseconomies of scale at what output levels?
A) output levels greater than N
B) output levels between M and N
C) output levels less than M
D) All of the above are correct as long as the firm is operating in the long run.
Correct Answer

verified
Correct Answer
verified
Multiple Choice
Table 13-8 -Refer to Table 13-8.What is the average variable cost of producing 5 units of output?
A) 4
B) 5
C) 40
D) 44
Correct Answer

verified
Correct Answer
verified
Multiple Choice
Refer to Table 13-2.At which number of workers does diminishing marginal product begin?
A) 1
B) 2
C) 3
D) 4
Correct Answer

verified
Correct Answer
verified
Multiple Choice
Table 13-13 -Refer to Table 13-13.What is the total fixed cost for this firm?
A) 20
B) 30
C) 40
D) 50
Correct Answer

verified
Correct Answer
verified
Multiple Choice
Figure 13-1  -Refer to Figure 13-1.Which of the following could explain why the total product curve would shift from TP2 to TP1?
A) There is additional capital equipment available to the firm.
B) Labor skills have become rusty and outdated in the firm.
C) The firm has developed improved production technology.
D) The firm is now receiving a higher price for its product.
Correct Answer

verified
Correct Answer
verified
Multiple Choice
When a firm's only variable input is labor,then the slope of the production function measures the
A) quantity of labor.
B) quantity of output.
C) total cost.
D) marginal product of labor.
Correct Answer

verified
Correct Answer
verified
Multiple Choice
The long-run average total cost curve is always
A) flatter than the short-run average total cost curve,but not necessarily horizontal.
B) horizontal.
C) falling as output increases.
D) rising as output increases.
Correct Answer

verified
Correct Answer
verified
Multiple Choice
A production function describes
A) how a firm maximizes profits.
B) how a firm turns inputs into output.
C) the minimal cost of producing a given level of output.
D) the relationship between cost and output.
Correct Answer

verified
Correct Answer
verified
Multiple Choice
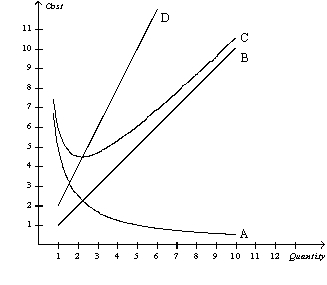
Figure 13-5  -Refer to Figure 13-5.Curve D is increasing because
A) of diminishing marginal product.
B) of increasing marginal product.
C) marginal product first increases,then decreases.
D) marginal product first decreases,then increases.
Correct Answer

verified
Correct Answer
verified
Essay
What effect,if any,does diminishing marginal product have on the shape of the marginal cost curve?
Correct Answer

verified
Diminishing marginal product causes the marginal cost curve to rise.
Correct Answer
verified
True/False
Adam Smith's example of the pin factory demonstrates that economies of scale result from specialization.
Correct Answer

verified
Correct Answer
verified
True/False
When economists speak of a firm's costs,they are usually excluding the opportunity costs.
Correct Answer

verified
Correct Answer
verified
Multiple Choice
Marginal cost increases as the quantity of output increases.This reflects the property of
A) increasing total cost.
B) diminishing total cost.
C) increasing marginal product.
D) diminishing marginal product.
Correct Answer

verified
D
Correct Answer
verified
Multiple Choice
Consider the following information about bread production at Beth's Bakery: Beth pays all her workers the same wage,and labor is her only variable cost.From this information we can conclude that Beth's marginal cost
A) declines as output increases from 0 to 33,but increases after that.
B) declines as output increases from 0 to 11,but increases after that.
C) increases as output increases from 0 to 11,but declines after that.
D) is constant.
Correct Answer

verified
Correct Answer
verified
Multiple Choice
In the long run Firm A incurs total costs of $900 when output is 30 units and $1,200 when output is 40 units.Firm A exhibits
A) diseconomies of scale because total cost is rising as output rises.
B) constant returns to scale because average total cost is constant as output rises.
C) diseconomies of scale because average total cost is rising as output rises.
D) economies of scale because average total cost is falling as output rises.
Correct Answer

verified
Correct Answer
verified
Showing 1 - 20 of 67
Related Exams