Correct Answer

verified
Correct Answer
verified
Multiple Choice
What is the value of the Pearson coefficient of skewness for a distribution with a mean of 17, median of 12 and standard deviation of 6?
A) +2.5
B) -2.5
C) +0.83
D) -0.83
Correct Answer

verified
Correct Answer
verified
Multiple Choice
Quartiles divide a distribution into
A) 2 equal parts.
B) 4 equal parts.
C) 10 equal parts.
D) 100 equal parts.
Correct Answer

verified
Correct Answer
verified
True/False
In a stem-and-leaf display, the leaf represents a class of a frequency distribution.
Correct Answer

verified
Correct Answer
verified
Multiple Choice
A dot plot is best applied for a data set with
A) 1,000 observations.
B) 50 observations.
C) More than one variable.
D) A one mode.
Correct Answer

verified
Correct Answer
verified
True/False
A dot plot is useful for quickly graphing frequencies in a small data set.
Correct Answer

verified
Correct Answer
verified
True/False
A relationship between gender and preference for Coke or Pepsi can be best represented by a scatter diagram.
Correct Answer

verified
Correct Answer
verified
Short Answer
What statistic can be used to measure the relative symmetry of a distribution? ___________________________________
Correct Answer

verified
Coefficien...View Answer
Show Answer
Correct Answer
verified
View Answer
Multiple Choice
To locate the percentile for a given observation in a data set, the data must be
A) Sorted and listed from the minimum to the maximum values.
B) Displayed in a histogram.
C) Summarized in a cumulative frequency distribution.
D) Distributed symmetrically around the mean.
Correct Answer

verified
Correct Answer
verified
Multiple Choice
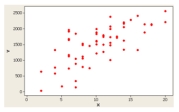
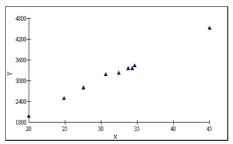
The following graph is a 
A) Dot plot
B) Stem-and-leaf display
C) Box plot
D) Scatter Plot
Correct Answer

verified
Correct Answer
verified
Multiple Choice
What does the interquartile range describe?
A) The lower 50% of the observations
B) The middle 50% of the observations
C) The upper 50% of the observations
D) The lower 25% and the upper 25% of the observations
Correct Answer

verified
Correct Answer
verified
Multiple Choice
Percentiles divide a distribution into
A) 2 equal parts.
B) 4 equal parts.
C) 10 equal parts.
D) 100 equal parts.
Correct Answer

verified
Correct Answer
verified
True/False
A student scored in the 85th percentile on a standardized test. This means that the student scored lower than 85% of all students who took the test.
Correct Answer

verified
Correct Answer
verified
Short Answer
What chart or graph uses dots to show frequencies? ________________
Correct Answer

verified
Correct Answer
verified
Short Answer
For the following data, are any of the observations an outlier? 
Correct Answer

verified
Correct Answer
verified
True/False
A dot plot is useful for showing possible outliers.
Correct Answer

verified
Correct Answer
verified
Short Answer
For the following data, how many observations are in the data? 
Correct Answer

verified
Correct Answer
verified
Multiple Choice
In a distribution, the second quartile corresponds with the
A) Mean.
B) Median.
C) Mode.
D) Variance.
Correct Answer

verified
Correct Answer
verified
Short Answer
In a positively skewed distribution, the 50th percentile is the same as the _______________.
Correct Answer

verified
Correct Answer
verified
Short Answer
The interquartile range is the distance between ___________.
Correct Answer

verified
the first ...View Answer
Show Answer
Correct Answer
verified
View Answer
Showing 61 - 80 of 108
Related Exams