A) quantity supplied equals quantity demanded.
B) buyers and sellers "agree" on the quantity of a good they are willing to exchange at a given price.
C) the supply curve and demand curve intersect.
D) All of these statements are true.
Correct Answer

verified
Correct Answer
verified
Multiple Choice
Suppose there is a tornado that levels a city.As rebuilding begins,how might you analyze this effect in the market for lumber?
A) The demand for lumber would increase,increasing both the equilibrium price and quantity.
B) The supply of lumber would increase,decreasing the equilibrium price and increasing the equilibrium quantity.
C) The demand for lumber would increase,decreasing the equilibrium price and increasing the equilibrium quantity.
D) The supply of lumber would decrease,increasing the equilibrium price and decreasing the equilibrium quantity.
Correct Answer

verified
Correct Answer
verified
Multiple Choice
A decrease in the price of spaghetti is likely to cause:
A) a movement along the demand curve.
B) an inward shift of the demand curve.
C) an outward shift of the demand curve.
D) a rotation of the demand curve around the price-point change.
Correct Answer

verified
Correct Answer
verified
Multiple Choice
After getting a raise at work,Jasper now regularly buys steak instead of chicken.Which factor of demand has influenced Jasper's demand for steak?
A) Price of a substitute good
B) Price of a complementary good
C) Income
D) Preferences
Correct Answer

verified
Correct Answer
verified
Multiple Choice
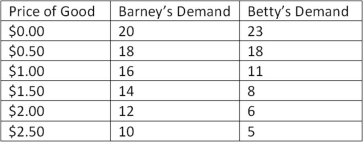
This table shows individual demand schedules for a market.  According to the table shown,what can be said of Betty and Barney's demand for this good?
A) Betty's and Barney's demand both follow the law of demand.
B) Barney's demand follows the law of demand,but Betty's does not.
C) Betty's demand follows the law of demand,but Barney's does not.
D) Neither Betty's nor Barney's demand follows the law of demand.
Correct Answer

verified
Correct Answer
verified
Multiple Choice
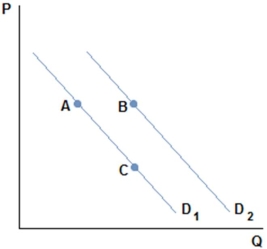
This graph depicts the demand for a normal good.  A movement from A to B in the graph shown might be caused by:
A) a decrease in the price of a substitute.
B) a decrease in the price of a complement.
C) an increase in the price of a complement.
D) an increase in the good's price.
Correct Answer

verified
Correct Answer
verified
Multiple Choice
How have the recent increases in the price of gasoline affected the market for hybrid cars?
A) The demand has increased,increasing the equilibrium price and quantity of hybrid cars.
B) The supply has increased,decreasing the equilibrium price and increasing the equilibrium quantity of hybrid cars.
C) The demand has increased,decreasing the equilibrium price and increasing the equilibrium quantity of hybrid cars.
D) The demand and supply of hybrid cars have both increased in response to changing gas prices,so the equilibrium quantity has definitely decreased,but the effect on price cannot be determined without more information.
Correct Answer

verified
Correct Answer
verified
Multiple Choice
Demand for Snickers bars will decrease if:
A) the price of Snickers bars decreases.
B) a news story claiming 95% of all geniuses eat at least one Snickers bar a day is released.
C) the price of Milky Way bars decreases.
D) the price of Milky Way bars increases.
Correct Answer

verified
Correct Answer
verified
Multiple Choice
The recent rise in the price of gasoline has caused:
A) automakers to produce more gas-efficient cars.
B) automakers to drop the price of gas-guzzling vehicles.
C) automakers to spend more money marketing bigger vehicles.
D) would not affect an automaker's supply decisions.
Correct Answer

verified
Correct Answer
verified
Multiple Choice
When graphing the demand curve:
A) quantity goes on the horizontal axis and price goes on the vertical axis.
B) quantity goes on the vertical axis and price goes on the horizontal axis.
C) Both quantity and price go on the horizontal axis.
D) It doesn't matter which axis price and quantity are placed on.
Correct Answer

verified
Correct Answer
verified
Multiple Choice
Consider a market that is in equilibrium.If it experiences both an increase in demand and a decrease in supply,what can be said of the new equilibrium?
A) The equilibrium price and quantity will both rise.
B) The equilibrium quantity will definitely rise,while the equilibrium price cannot be predicted.
C) The equilibrium price will definitely rise,while the equilibrium quantity cannot be predicted.
D) The equilibrium price and quantity will both fall.
Correct Answer

verified
Correct Answer
verified
Multiple Choice
Bob just got laid off and now has no income.We can assume that:
A) his demand for all normal goods will increase.
B) his demand for all inferior goods will increase.
C) his demand for all inferior goods will decrease.
D) his demand for all normal goods will stay the same,but will decrease for inferior goods.
Correct Answer

verified
Correct Answer
verified
Multiple Choice
The best example of a standardized good would be:
A) corn.
B) a handbag.
C) an autographed baseball.
D) None of these could be considered a standardized good.
Correct Answer

verified
Correct Answer
verified
Multiple Choice
A price taker is:
A) a buyer or seller who cannot affect the market price.
B) a buyer or seller who takes the market price and chooses to increase or decrease it.
C) a buyer or seller who takes prices in the area and averages them together to set the price for his/her good.
D) None of these statements is true.
Correct Answer

verified
Correct Answer
verified
Multiple Choice
The point at which buyers and sellers "agree" on the quantity of a good they are willing to exchange at a given price is called:
A) equilibrium.
B) optimization.
C) maximization.
D) market collapse.
Correct Answer

verified
Correct Answer
verified
Multiple Choice
Consider a market that is in equilibrium.If it experiences an increase in demand,what will happen?
A) The demand curve will shift to the right,and the equilibrium price and quantity will rise.
B) The demand curve will shift to the right,and the equilibrium price will increase and the equilibrium quantity will decrease.
C) The demand curve will shift to the right,and the equilibrium price and quantity will fall.
D) The demand curve will shift to the left,and the equilibrium price and quantity will fall.
Correct Answer

verified
Correct Answer
verified
Multiple Choice
The price of house paint,a normal good,has gone up.This change can be shown graphically as:
A) a shift in the demand curve to the right.
B) a shift in the demand curve to the left.
C) a movement along the demand curve to the right.
D) a movement along the demand curve to the left.
Correct Answer

verified
Correct Answer
verified
Multiple Choice
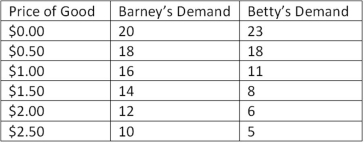
This table shows individual demand schedules for a market.  According to the table shown,what will the equilibrium price be in this market?
A) $0.50
B) $1.50
C) $2.00
D) Cannot be determined without more information.
Correct Answer

verified
Correct Answer
verified
Multiple Choice
The demand curve:
A) is a downward-sloping line that reflects the inverse relationship between price and quantity.
B) is an upward-sloping line that reflects the inverse relationship between price and quantity.
C) is a downward-sloping line that reflects the direct relationship between price and quantity.
D) is an upward-sloping line that reflects the direct relationship between price and quantity.
Correct Answer

verified
Correct Answer
verified
Multiple Choice
Darren loves to go to the movies,and he just learned that he can buy a ticket at a discounted price if he shows his student ID.Darren now attends the movies even more often.The change in Darren's behavior would be shown graphically by:
A) a rightward shift in his demand curve.
B) a leftward shift in his demand curve.
C) a movement down along his demand curve.
D) a movement up along his demand curve.
Correct Answer

verified
Correct Answer
verified
Showing 121 - 140 of 145
Related Exams