A) There are too few intervals.
B) Some numbers between 0 and 29, inclusively, would not fall into any interval.
C) The first and second interval overlaps.
D) There are too many intervals.
E) The second and the third interval overlap.
Correct Answer

verified
Correct Answer
verified
Multiple Choice
Which of the following would be most helpful in constructing a pie chart?
A) cumulative percent
B) relative frequency
C) ogive
D) frequency
E) none of the above
Correct Answer

verified
Correct Answer
verified
True/False
A summary of data in which raw data are grouped into different intervals and the number of items in each group is listed is called a frequency distribution.
Correct Answer

verified
Correct Answer
verified
Multiple Choice
Each day, the manager at Jamie's Auto Care Shop prepares a frequency distribution and a histogram of sales transactions by dollar value of the transactions. Friday's histogram follows: 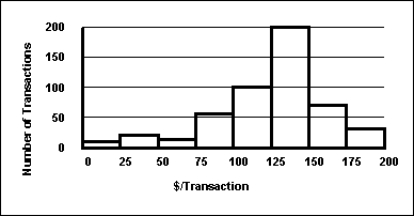 On Friday, the approximate number of sales transactions in the 75-under 100 category was ___.
A) 50
B) 100
C) 150
D) 200
E) 60
Correct Answer

verified
Correct Answer
verified
True/False
A Pareto chart and a pie chart are both types of categorical graphs.
Correct Answer

verified
Correct Answer
verified
Multiple Choice
The staff of Mr. Wayne Wertz, VP of Operations at Portland Peoples Bank, prepared a frequency histogram of waiting time for drive up ATM customers. 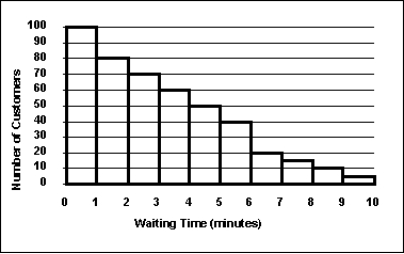 Approximately ___ drive up ATM customers waited less than 2 minutes.
A) 20
B) 30
C) 100
D) 180
E) 200
Correct Answer

verified
Correct Answer
verified
Multiple Choice
In a frequency distribution, the first class interval begins at 18. The midpoint of the first class interval is 19.5, and the midpoint of the last class interval is 49.5. How many class intervals are there?
A) 11
B) 17
C) 22
D) 33
E) 34
Correct Answer

verified
Correct Answer
verified
True/False
One rule that must always be followed in constructing frequency distributions is that the adjacent classes must overlap.
Correct Answer

verified
Correct Answer
verified
Multiple Choice
The staff of Ms. Tamara Hill, VP of Technical Analysis at Blue Sky Brokerage, prepared a frequency histogram of market capitalization of the 937 corporations listed on the American Stock Exchange in January 2013. 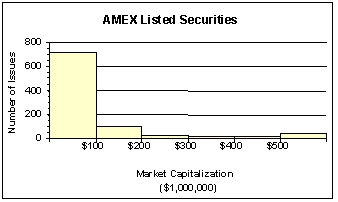 Approximately ___ corporations had capitalization exceeding $200,000,000.
A) 50
B) 100
C) 700
D) 800
E) 890
Correct Answer

verified
Correct Answer
verified
Multiple Choice
The customer help center in your company receives calls from customers who need help with some of the customized software solutions your company provides. The staff prepare the following cumulative frequency polygon (ogive) for waiting times during the last three months. What percentage of customers had waiting times exceeding 6 minutes? 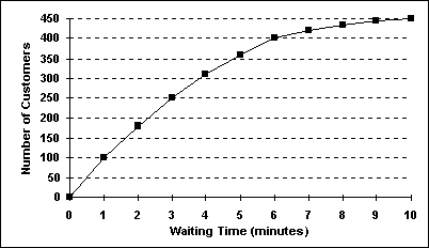
A) 7%
B) 8%
C) 11%
D) 12%
E) 89%
Correct Answer

verified
Correct Answer
verified
Multiple Choice
Each day, the manager at Jamie's Auto Care prepares a frequency distribution and a histogram of sales transactions by dollar value of the transactions. Friday's histogram follows: 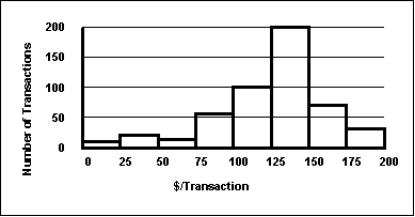 On Friday, the approximate number of sales transactions between $150 and $175 was ___.
A) 75
B) 200
C) 300
D) 400
E) 500
Correct Answer

verified
Correct Answer
verified
True/False
A scatter plot shows how the numbers in a data set are scattered around their average.
Correct Answer

verified
Correct Answer
verified
Multiple Choice
Consider the following frequency distribution:  What is the relative frequency of the first class?
A) 0.15
B) 0.30
C) 0.10
D) 0.20
E) 0.40
Correct Answer

verified
Correct Answer
verified
Multiple Choice
The 2010 and 2012 market share data of the three competitors (Alston, Baren, and Clemson) in an oligopolistic industry are presented in the following pie charts. Total sales for this industry were $1.5 billion in 2010 and $1.8 billion in 2012. Baren's sales in 2010 were ___. 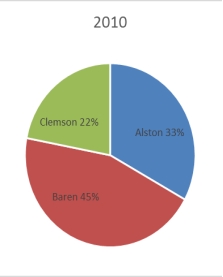
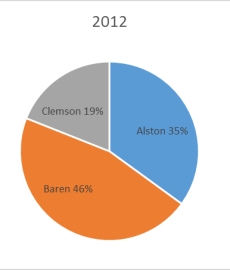
A) $342 million
B) $630 million
C) $675 million
D) $828 million
E) $928 million
Correct Answer

verified
Correct Answer
verified
Multiple Choice
According to the following graphic, "Bent Pins" account for ___% of PCB Failures. 
A) 10
B) 20
C) 30
D) 40
E) 50
Correct Answer

verified
Correct Answer
verified
Showing 81 - 95 of 95
Related Exams