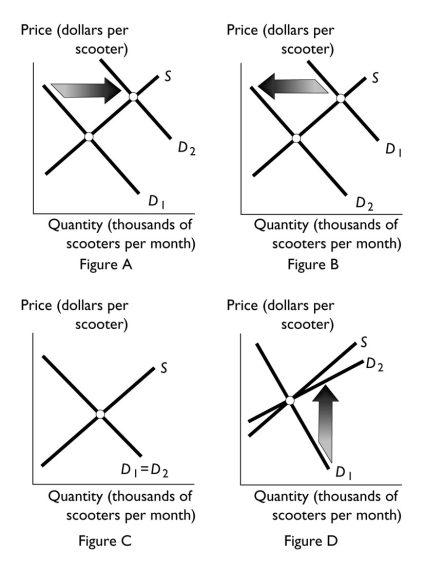
A) Figure A
B) Figure B
C) Figure C
D) Figure D
E) None of the figures represent this change.
Correct Answer

verified
Correct Answer
verified
Multiple Choice
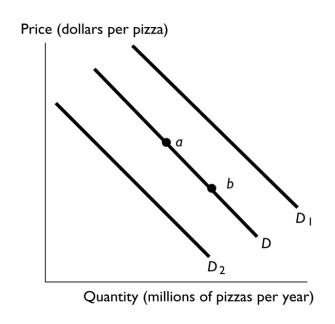
 -In the above figure,________ will shift in the demand curve from D to D₁.
A) an increase in income if pizza is an inferior good
B) a decrease in the price of a sub sandwich, a substitute for pizza
C) buyers' expectation that pizza will be less expensive next week
D) a scientific article published that demonstrates eating pizza is good for one's health
E) a fall in the cost of producing pizza
Correct Answer

verified
Correct Answer
verified
Multiple Choice
If the demand for used cars decreases after the price of a new car falls,used cars and new cars are
A) inferior goods.
B) substitute goods.
C) complementary goods.
D) normal goods.
E) The questions errs because it is the quantity of used cars, NOT the demand for used cars, that will change when the price of a new car falls.
Correct Answer

verified
Correct Answer
verified
Multiple Choice
Which of the following statements is true about a competitive market? A competitive market
A) must have a physical location.
B) includes markets for goods and services but not for inputs.
C) has so many buyers and sellers that no one can influence the price.
D) has one seller competing to sell his or her product.
E) has a handful of sellers but always has many buyers.
Correct Answer

verified
Correct Answer
verified
Multiple Choice
The market demand curve
A) cannot show how quantity demanded changes in response to a change in price.
B) cannot show a change in demand for a good.
C) is the horizontal sum of individual demand curves.
D) is the vertical sum of individual demand curves.
E) is upward sloping.
Correct Answer

verified
Correct Answer
verified
Multiple Choice
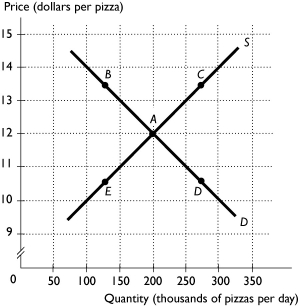
 -The above figure shows the market for pizza.The market is in equilibrium when the cheese used to produce pizza falls in price.What point represents the most likely new price and quantity?
A) A
B) B
C) C
D) D
E) E
Correct Answer

verified
Correct Answer
verified
Multiple Choice
For consumers,taco chips and salsa are complements.If the price of salsa rises,what is the effect on the equilibrium price and quantity of taco chips?
A) The equilibrium price of taco chips falls and the equilibrium quantity decreases.
B) The equilibrium price of taco chips rises and the equilibrium quantity decreases.
C) There is no change in the equilibrium price of taco chips and the equilibrium quantity increases.
D) The equilibrium price of taco chips could rise, fall, or stay the same and the equilibrium quantity increases.
E) The equilibrium price of taco chips rises and the equilibrium quantity increases.
Correct Answer

verified
Correct Answer
verified
Multiple Choice
The downward slope of a demand curve
A) represents the law of demand.
B) shows that as the price of a good rises, consumers increase the quantity they demand.
C) indicates how the quantity demanded changes when incomes rise and the good is a normal good.
D) indicates how demand changes when incomes rise and the good is a normal good.
E) indicates how demand changes when the price changes and the good is a normal good.
Correct Answer

verified
Correct Answer
verified
Multiple Choice
A demand curve
A) has an upward slope.
B) has a downward slope.
C) is a graph of the relationship between quantity demanded of a good and its price.
D) Both answers B and C are correct.
E) Both answers A and C are correct.
Correct Answer

verified
Correct Answer
verified
Multiple Choice
Assume a competitive market is in equilibrium.There is an increase in demand,but no change in supply.As a result the equilibrium price ________,and the equilibrium quantity ________.
A) rises; increases
B) rises; does not change
C) falls; does not change
D) falls; decreases
E) falls; increases
Correct Answer

verified
Correct Answer
verified
Multiple Choice
Which of the following increases the demand for a good?
A) a rise in the price of a complement
B) the expectation that future income will be higher
C) an increase in income, assuming the good is an inferior good
D) a decrease in the number of buyers
E) a fall in the price of a substitute
Correct Answer

verified
Correct Answer
verified
Multiple Choice
 -The table above shows the situation in the gasoline market in Tulsa,Oklahoma.If the price of a gallon of gasoline is $3.62,then
A) there is a surplus of gasoline in Tulsa.
B) there is a shortage of gasoline in Tulsa.
C) the gasoline market in Tulsa is in equilibrium.
D) without more information we cannot determine if there is a surplus, a shortage, or an equilibrium in the gasoline market in Tulsa.
E) there is neither a surplus nor a shortage, but the market is NOT in equilibrium.
Correct Answer

verified
Correct Answer
verified
Multiple Choice
A competitive market is in equilibrium.Then there is an increase in demand and an increase in supply.The equilibrium price ________,and the equilibrium quantity ________.
A) rises; increases
B) perhaps changes but we can't say if it rises, falls, or stays the same; does not change
C) falls; increases
D) perhaps changes but we can't say if it rises, falls, or stays the same; increases
E) falls; perhaps changes but we can't say if it increases, decreases, or stays the same
Correct Answer

verified
Correct Answer
verified
Multiple Choice
A technological improvement lowers the cost of producing corn.As a result,the price of a pound of corn ________ and the quantity of corn ________.
A) rises; increases
B) rises; decreases
C) falls; increases
D) falls; decreases
E) falls; does not change
Correct Answer

verified
Correct Answer
verified
Multiple Choice
As a falling price eliminates a surplus in the jersey market,
A) the demand curve for jerseys shifts leftward and the supply curve of jerseys shifts rightward.
B) consumers increase the quantity of jerseys they demand.
C) producers increase the quantity of jerseys they supply.
D) producers decrease the quantity of jerseys they supply and buyers decrease the quantity of jerseys they demand.
E) the demand curve for jerseys shifts rightward and the supply curve of jerseys shifts leftward.
Correct Answer

verified
Correct Answer
verified
Multiple Choice
Bagels and cream cheese are complementary goods.Suppose that the price for flour,which is used to produce bagels,increases.The equilibrium price of cream cheese ________ and the equilibrium quantity of cream cheese ________.
A) rises; decreases
B) rises; increases
C) falls; decreases
D) does not change; does not change
E) falls; increases
Correct Answer

verified
Correct Answer
verified
Multiple Choice
A change in the demand for apples could result from any of the following EXCEPT
A) a change in the number of buyers.
B) increased preferences for fresh fruit consumption for health reasons.
C) a change in the price of an apple.
D) a change in the price of a banana.
E) a change in income.
Correct Answer

verified
Correct Answer
verified
Multiple Choice
Fresh orange juice and frozen orange juice are substitutes in production.The price of fresh orange juice rises.As a result,the equilibrium price of frozen orange juice ________ and the equilibrium quantity ________.
A) rises; increases
B) rises; decreases
C) falls; increases
D) falls; decreases
E) does not change; decreases
Correct Answer

verified
Correct Answer
verified
Multiple Choice
 -Scooters and bicycles are substitutes.Suppose that the price of a bicycle falls.Which of the figures above best illustrates how this fall in price affects the demand curve for scooters?
A) Figure A
B) Figure B
C) Figure C
D) Figure D
E) None of the above answers is correct because the change in the price of a bicycle will affect the supply curve not the demand curve.
Correct Answer

verified
Correct Answer
verified
Multiple Choice
 -Over the next few years more and more people prefer to ride on scooters.Which of the figures above best illustrates how this change affects the demand curve for scooters?
A) Figure A
B) Figure B
C) Figure C
D) Figure D
E) None of the above answers is correct because the change in tastes will affect the supply curve not the demand curve.
Correct Answer

verified
Correct Answer
verified
Showing 261 - 280 of 322
Related Exams