Correct Answer
Multiple Choice
In a pie chart, slices that are pulled away are said to be ____.
A) identified
B) exploded
C) opened
D) extracted
Correct Answer

verified
Correct Answer
verified
True/False
You can create multiple charts based on the same worksheet data.
Correct Answer

verified
Correct Answer
verified
Multiple Choice
A(n) ____ chart compares distinct object levels using a vertical format; is the Excel default.
A) line
B) area
C) column
D) pie
Correct Answer

verified
Correct Answer
verified
Multiple Choice
Which chart type would you use to compare distinct objects over time using a horizontal format?
A) Area
B) Bar
C) Column
D) Line
Correct Answer

verified
Correct Answer
verified
Multiple Choice
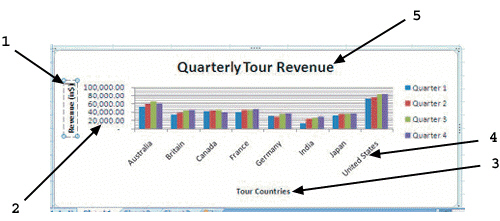
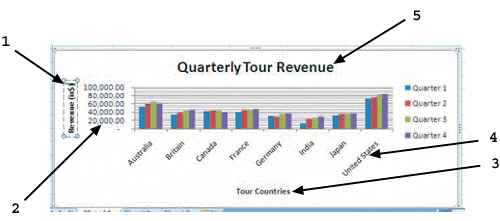
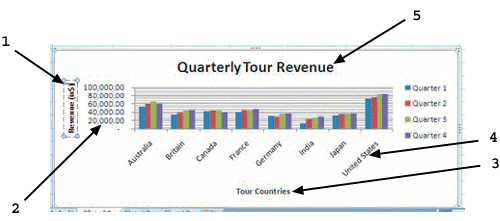
 As shown in the figure above, item 4 points to a ____.
A) vertical axis label
B) horizontal axis label
C) horizontal axis title
D) vertical axis title
Correct Answer

verified
Correct Answer
verified
True/False
The area inside the horizontal and vertical axes is the legend .
Correct Answer

verified
Correct Answer
verified
Essay
Describe some of the changes that you can make to a chart using the Chart Tools Design tab.
Correct Answer

verified
Using the Chart Tools Design tab, you ca...View Answer
Show Answer
Correct Answer
verified
View Answer
Short Answer
The ____________________, the small series of dots at the corners and sides of the chart's border, indicate that the chart is selected.
Correct Answer

verified
Correct Answer
verified
Multiple Choice
____ are the horizontal and vertical lines in a chart that enable the eye to follow the value on an axis.
A) Tick marks
B) Axis lines
C) Arrows
D) Gridlines
Correct Answer

verified
Correct Answer
verified
True/False
Moving a chart object around on a worksheet can affect the data in the worksheet.
Correct Answer

verified
Correct Answer
verified
True/False
You can resize a chart to improve its appearance by dragging its sizing handles .
Correct Answer

verified
Correct Answer
verified
Multiple Choice
 As shown in the figure above, item 2 points to a ____.
A) vertical axis label
B) horizontal axis label
C) horizontal axis title
D) vertical axis title
Correct Answer

verified
Correct Answer
verified
Multiple Choice
 As shown in the figure above, item 3 points to a ____.
A) vertical axis label
B) horizontal axis label
C) horizontal axis title
D) vertical axis title
Correct Answer

verified
Correct Answer
verified
Essay
Discuss the guidelines that you should use for planning a chart.
Correct Answer

verified
Determine the purpose of the chart and i...View Answer
Show Answer
Correct Answer
verified
View Answer
Multiple Choice
____ lets you create diagram types including List, Process, Cycle, Hierarchy, Relationship, Matrix, and Pyramid.
A) SmartArt
B) WordArt
C) ClipArt
D) 3-DArt
Correct Answer

verified
Correct Answer
verified
True/False
The horizontal axis is also called the value axis.
Correct Answer

verified
Correct Answer
verified
Multiple Choice
____ make it possible to apply multiple formats to a data series, such as an outline, fill color, and text color, all with a single click.
A) Text annotations
B) Gridlines
C) Markers
D) Styles
Correct Answer

verified
Correct Answer
verified
Essay
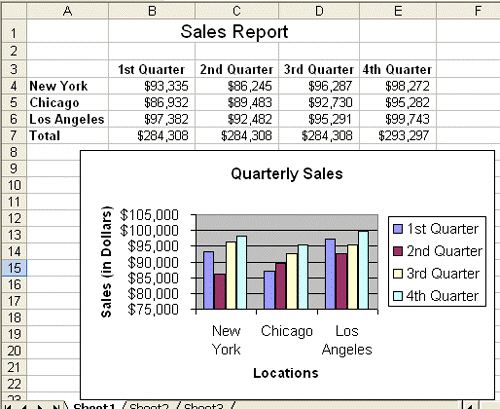
You are a manager in the Sales department for a clothing store that has three locations. You have prepared the following worksheet containing data about the sales figures for the company, which also has a chart of the data.  What are the horizontal axis labels in the chart?
Correct Answer

verified
New York, ...View Answer
Show Answer
Correct Answer
verified
View Answer
Multiple Choice
Text annotations are ____ that you can add to further describe the data in your chart.
A) arrows
B) titles
C) labels
D) notes
Correct Answer

verified
Correct Answer
verified
Showing 41 - 60 of 66
Related Exams