A) Hares decrease in number just before lynx population size begins to increase.
B) Lynx likely control hare population density.
C) Lynx and hare populations are independent of each other.
D) The relationship between the populations cannot be determined only from this graph.
Correct Answer

verified
Correct Answer
verified
Multiple Choice
Often the growth cycle of one population has an effect on the cycle of another. As moose populations increase, for example, wolf populations also increase. Thus, if we are considering the logistic equation for the wolf population,  = rN
= rN  Which of the factors accounts for the effect of the moose population?
A) r
B) N
C) rN
D) K
Correct Answer

verified
Correct Answer
verified
Multiple Choice
In 2019, the population of New Zealand was approximately 4,794,000 people. If the birth rate was approximately 13 births per 1,000 people, approximately how many births occurred in 2019?
A) 6,711
B) 14,000
C) 62,322
D) 623,000
Correct Answer

verified
Correct Answer
verified
Multiple Choice
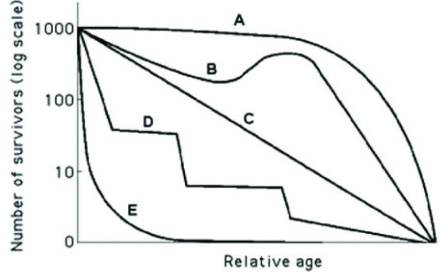
Use the hypothetical or idealized survivorship curves in the figure to answer the following question.  Which of the following curves best describes survivorship in a typical elephant population?
A) A
B) B
C) C
D) D
Correct Answer

verified
Correct Answer
verified
Multiple Choice
Which of the following graphs best illustrates the growth curve of a small population of rodents that has increased to a static carrying capacity?
A) ![]()
B) ![]()
C) ![]()
D) ![]()
Correct Answer

verified
Correct Answer
verified
Multiple Choice
In 2019, the United States Census Bureau reported the various components of population change as estimated below. ∙ One birth every 8 seconds ∙ One death every 11 seconds ∙ One international migrant (net of immigrants versus emigrants) every 33 seconds ∙ Net gain of one person every 17 seconds During that year, which component was four times slower than the birth rate?
A) The net immigration rate
B) The net emigration rate
C) The birth rate
D) The death rate
Correct Answer

verified
Correct Answer
verified
Multiple Choice
A population's carrying capacity ________.
A) may change as environmental conditions change
B) can be accurately calculated using the logistic growth model
C) increases as the per capita population growth rate decreases
D) can never be exceeded
Correct Answer

verified
Correct Answer
verified
Multiple Choice
According to the logistic growth equation below, ________.  = rN
= rN 
A) the number of individuals added per unit time is greatest when N is close to zero
B) the per capita population growth rate increases as N approaches K
C) population growth is zero when N equals K
D) the population grows exponentially when K is small
Correct Answer

verified
Correct Answer
verified
Multiple Choice
Which of the following techniques would provide the most accurate data on population density?
A) Count the number of nests of a particular species of songbird and multiply this by a factor that extrapolates these data to actual animals.
B) Count the number of pine trees in several randomly selected 10-meter-square plots within a population, and extrapolate this number to the fraction of the study area these plots represent.
C) Use the mark-recapture method to estimate the number of individuals in the population.
D) Calculate the difference between all of the immigrants and emigrants to see if the population is growing or shrinking.
Correct Answer

verified
Correct Answer
verified
Multiple Choice
Which of the following statements about human populations in industrialized countries is correct?
A) Birth rates and death rates are high.
B) Average family size is relatively large.
C) The population has undergone the demographic transition.
D) The survivorship curve is Type II.
Correct Answer

verified
Correct Answer
verified
Multiple Choice
Ecologists define carrying capacity (K) as the maximum population size that a particular environment can sustain. Which statement about K is correct?
A) K varies among populations and in time.
B) K varies in space and is constant for any given species.
C) K varies among populations and in space and time.
D) K varies in space and time and is constant for any given species.
Correct Answer

verified
Correct Answer
verified
Multiple Choice
The observation that members of a population are uniformly distributed suggests that ________.
A) resources are distributed unevenly.
B) the members of the population are competing for access to a resource.
C) the members of the population are neither attracted to nor repelled by one another.
D) the density of the population is low.
Correct Answer

verified
Correct Answer
verified
Multiple Choice
Analyzing ecological footprints reveals that ________.
A) Earth's carrying capacity would increase if per capita meat consumption increased
B) current demand by industrialized countries for resources is much smaller than the ecological footprint of those countries
C) it is not possible for technological improvements to increase Earth's carrying capacity for humans
D) the ecological footprint of the United States is large because per capita resource use is high
Correct Answer

verified
Correct Answer
verified
Multiple Choice
An ecologist recorded 12 white-tailed deer, Odocoileus virginianus, per square kilometer (km2) in one woodlot and 20/km2 in another woodlot. These data could be best used to answer which of the following questions?
A) How does the density of deer vary among similar habitats?
B) When deer disperse within their habitat, are they physically clumped or uniform?
C) Is the carrying capacity of the two woodlots controlled by availability of food, or of water?
D) What is the range of a white-tailed deer?
Correct Answer

verified
Correct Answer
verified
Multiple Choice
Which of the following graphs illustrates the growth over several seasons of a population of snowshoe hares that were introduced to an appropriate habitat also inhabited by predators in northern Canada?
A) ![]()
B) ![]()
C) ![]()
D) ![]()
Correct Answer

verified
Correct Answer
verified
Multiple Choice
Population ecologists follow the fate of same-age cohorts to ________.
A) determine a population's carrying capacity
B) determine the birth rate and death rate of each group in a population
C) determine if a population is regulated by density-dependent processes
D) determine the factors that affect the size of a population
Correct Answer

verified
Correct Answer
verified
Multiple Choice
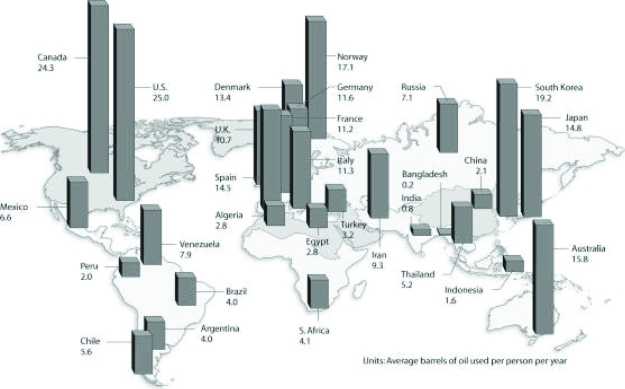
Use the figure to answer the following question.  Based on the figure and given the populations of the following countries, which country uses the most oil overall?
A) United States (population = 320 million)
B) Canada (population = 36 million)
C) China (population = 1.33 billion)
D) Russia (population = 144 million)
Correct Answer

verified
Correct Answer
verified
Multiple Choice
In the process of researching how to manage a large game ranch, historical accounts indicated that a species of deer that once lived there had been extirpated. After doing some research to determine what might be an appropriately sized founding population, managers reintroduced deer to the ranch. The population then increased for several generations, and the managers graphed the number of individuals (vertical axis) against time, or the number of generations (horizontal axis) . If no natural predators are impacting the population, which of the following graphs best represents the population?
A) ![]()
B) ![]()
C) ![]()
D) ![]()
Correct Answer

verified
Correct Answer
verified
Multiple Choice
Use the table to answer the following question.
 In the accompanying life table of a hypothetical population, what are the missing values for lx (y and z) ? lx = the proportion alive at the start of year (age specific survivorship rate) .
A) y = 0.3, z = 0.1
B) y = 1.0, z = 0.5
C) y = 0.5, z = 0.1
D) y = 1.0, z = 0.2
Correct Answer

verified
Correct Answer
verified
Multiple Choice
Which of the following traits is characteristic of K-selected populations?
A) offspring with good chances of survival
B) many offspring per reproductive episode
C) small offspring
D) a high intrinsic rate of increase
Correct Answer

verified
Correct Answer
verified
Showing 21 - 40 of 73
Related Exams