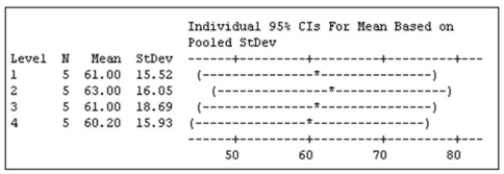
A) 3.29
B) 3.68
C) 3.59
D) 3.20
Correct Answer

verified
Correct Answer
verified
Multiple Choice
An electronics company wants to compare the quality of their cell phones to the cell phones from Three competitors. They sample 10 phones from each company and count the number of defects for Each phone. Using Excel, what test is used to compare the average number of defects?
A) ANOVA: Single Factor.
B) ANOVA: Two-Factor with Replication.
C) ANOVA: Two-Factor without Replication.
D) F-Test Two Sample for Variances.
E) t-Test: Paired Two Sample for Means.
Correct Answer

verified
Correct Answer
verified
Multiple Choice
A large department store examined a sample of the 18 credit card sales and recorded the amounts Charged for each of three types of credit cards: MasterCard, Visa and American Express. Six MasterCard sales, seven Visa and five American Express sales were recorded. The store used ANOVA to test if the mean sales for each credit card were equal. What are the degrees of freedom For the F statistic?
A) 18 in the numerator, 3 in the denominator.
B) 3 in the numerator, 18 in the denominator.
C) 2 in the numerator, 15 in the denominator.
D) 0 in the numerator, 15 in the denominator.
Correct Answer

verified
Correct Answer
verified
Multiple Choice
i. The statistical technique used to test the equality of three or more population means is called Analysis of variance (ANOVA) . ii. To employ ANOVA, the populations should have approximately equal standard deviations. iii. To employ ANOVA, the populations being studied must be approximately normally distributed.
A) (i) , (ii) , and (iii) are all correct statements.
B) (i) and (ii) are correct statements but not (iii) .
C) (i) and (iii) are correct statements but not (ii) .
D) (ii) and (iii) are correct statements but not (i) .
E) (i) , (ii) , and (iii) are all false statements.
Correct Answer

verified
Correct Answer
verified
Multiple Choice
Which one of the following is not assumed in the use of ANOVA?
A) The populations follow a normal distribution.
B) The samples have equal standard deviations.
C) The populations have equal standard deviations.
D) The populations are independent.
Correct Answer

verified
Correct Answer
verified
Multiple Choice
A manufacturer of automobile transmissions uses three different processes. The management
Ordered a study of the production costs to see if there is a difference among the three processes. A
Summary of the findings is shown below.  What is the critical value of F at the 1% level of significance?
A) 99.46
B) 5.49
C) 5.39
D) 4.61
Correct Answer

verified
Correct Answer
verified
Multiple Choice
i. The shape of the F distribution is determined by the degrees of freedom for the F-statistic, one for The numerator and one for the denominator. ii. The F distribution's curve is positively skewed. iii. Unlike Student's t distribution, there is only one F distribution.
A) (i) , (ii) , and (iii) are all correct statements.
B) (i) and (ii) are correct statements but not (iii) .
C) (i) and (iii) are correct statements but not (ii) .
D) (ii) and (iii) are correct statements but not (i) .
E) (i) , (ii) , and (iii) are all false statements.
Correct Answer

verified
Correct Answer
verified
Multiple Choice
An ANOVA comparing the waiting times for four different emergency rooms shows the following
Comparison of the four mean waiting times.  Which two pairs of means are significantly different?
A) ER1 is significantly different from ER2.
B) ER1 is significantly different from ER3.
C) ER1 is significantly different from ER4.
D) ER1 is significantly different from ER2; ER4 is significantly different from ER2.
E) ER2 is significantly different from ER3; ER4 is significantly different from ER3.
Correct Answer

verified
Correct Answer
verified
Multiple Choice
Analysis of variance is used to:
A) compare nominal data.
B) compute t test.
C) compare population proportion.
D) simultaneously compare several population means.
Correct Answer

verified
Correct Answer
verified
Multiple Choice
A preliminary study of hourly wages paid to unskilled employees in three metropolitan areas was Conducted. Seven employees were included from Area A, 9 from Area B and 12 from Area D The test statistic was computed to be 4.91. What can we conclude at the 0.05 level?
A) Mean hourly wages of unskilled employees all areas are equal.
B) Mean hourly wages in at least 2 metropolitan areas are different.
C) More degrees of freedom are needed.
Correct Answer

verified
Correct Answer
verified
Multiple Choice
A random sample of 30 executives from companies with assets over $1 million was selected and
Asked for their annual income and level of education. The ANOVA comparing the average income
Among three levels of education rejected the null hypothesis. The Mean Square Error (MSE) was
243) 7. The following table summarized the results:  Based on the comparison between the mean annual incomes for executives with Undergraduate
And Master's Degree or more.
A) a confidence interval shows that the mean annual incomes are not significantly different.
B) the ANOVA results show that the mean annual incomes are significantly different.
C) a confidence interval shows that the mean annual incomes are significantly different.
D) the ANOVA results show that the mean annual incomes are not significantly different.
Correct Answer

verified
Correct Answer
verified
Multiple Choice
i. If we want to determine which treatment means differ, one method is confidence intervals. ii. If the confidence interval includes 0, there is a difference in the pair of treatment means. iii. If both end points of a confidence interval are of the same sign, it indicates that the treatment Means are not different.
A) (i) , (ii) , and (iii) are all correct statements.
B) (i) and (ii) are correct statements but not (iii) .
C) (i) and (iii) are correct statements but not (ii) .
D) (i) is a correct statement but not (ii) or (iii) .
E) (i) , (ii) , and (iii) are all false statements.
Correct Answer

verified
Correct Answer
verified
Multiple Choice
What distribution does the F distribution approach as the sample size increases?
A) Binomial
B) Normal
C) Poisson
D) Exponential
Correct Answer

verified
Correct Answer
verified
Multiple Choice
i. To employ ANOVA, the populations should have approximately equal standard deviations. ii. To employ ANOVA, the populations being studied must be approximately normally distributed. iii. The least number of sources of variation in ANOVA is two.
A) (i) , (ii) , and (iii) are all correct statements.
B) (i) and (ii) are correct statements but not (iii) .
C) (i) and (iii) are correct statements but not (ii) .
D) (ii) and (iii) are correct statements but not (i) .
E) (i) , (ii) , and (iii) are all false statements.
Correct Answer

verified
Correct Answer
verified
Multiple Choice
A manufacturer of automobile transmissions uses three different processes. The management
Ordered a study of the production costs to see if there is a difference among the three processes. A
Summary of the findings is shown below.  What is the mean square for error?
A) 2.511
B) 2.151
C) 33.9
D) 29.035
Correct Answer

verified
Correct Answer
verified
Multiple Choice
i. The test statistic used in ANOVA is F. ii. The calculated F value must be equal to or greater than zero (0) . iii. The shape of the F distribution is symmetrical.
A) (i) , (ii) , and (iii) are all correct statements.
B) (i) and (ii) are correct statements but not (iii) .
C) (i) and (iii) are correct statements but not (ii) .
D) (ii) and (iii) are correct statements but not (i) .
E) (i) , (ii) , and (iii) are all false statements.
Correct Answer

verified
Correct Answer
verified
Multiple Choice
i. The alternate hypothesis for ANOVA states that not all the means are equal. ii. For an ANOVA test, rejection of the null hypothesis does not identify which populations differ Significantly. iii. If the computed value of F is 4.01 and the critical value is 2.67, we would conclude that all the Population means are equal.
A) (i) , (ii) , and (iii) are all correct statements.
B) (i) and (ii) are correct statements but not (iii) .
C) (i) and (iii) are correct statements but not (ii) .
D) (ii) and (iii) are correct statements but not (i) .
E) (i) , (ii) , and (iii) are all false statements.
Correct Answer

verified
Correct Answer
verified
Multiple Choice
A manufacturer of automobile transmissions uses three different processes. The management
Ordered a study of the production costs to see if there is a difference among the three processes. A
Summary of the findings is shown below.  What is the sum of squares of the error?
A) 67.80
B) 58.07
C) 149.34
D) 23.47
Correct Answer

verified
Correct Answer
verified
Multiple Choice
Random sample of executives from companies with assets over $1 million was selected and asked
For their annual income and level of education. The following MegaStat output summarized the
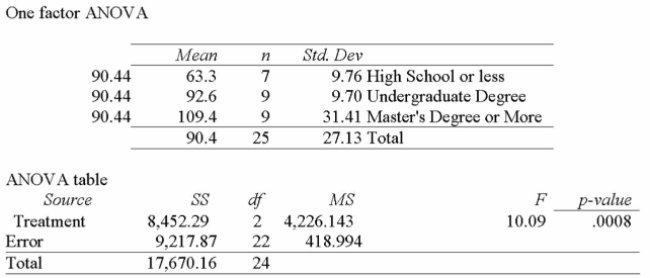
Results:  Using this output, what conclusions can you draw?
A) The total size of the sample used was 24.
B) Since the P-value is 0.0008, there is an 8% chance of these results happening when there is no significant difference in the incomes of these three groups.
C) Since the calculated F-value is large, and the P-value is so small, there is strong evidence to suggest that the three groups with different levels of education do not all have the same
Incomes.
D) Since the calculated F-value is large, and the P-value is so small, there is strong evidence to suggest that all three groups with different levels of education have the same incomes.
Correct Answer

verified
Correct Answer
verified
Multiple Choice
If an ANOVA test is conducted and the null hypothesis is rejected, what does this indicate?
A) Too many degrees of freedom.
B) No difference between the population means.
C) A difference between at least one pair of population means.
Correct Answer

verified
Correct Answer
verified
Showing 41 - 60 of 103
Related Exams