Correct Answer

verified
Correct Answer
verified
True/False
Correct Answer

verified
Correct Answer
verified
True/False
True or False: One of the consequences of collinearity in multiple regression is biased estimates on the slope coefficients.
Correct Answer

verified
Correct Answer
verified
Multiple Choice
A real estate builder wishes to determine how house size (House) is influenced by family income (Income) , family size (Size) , and education of the head of household (School) .House size is Measured in hundreds of square feet, income is measured in thousands of dollars, and education is In years.The builder randomly selected 50 families and constructed the multiple regression Model.The business literature involving human capital shows that education influences an Individual's annual income.Combined, these may influence family size.With this in mind, what Should the real estate builder be particularly concerned with when analyzing the multiple Regression model?
A) Randomness of error terms
B) Collinearity
C) Normality of residuals
D) Missing observations
Correct Answer

verified
Correct Answer
verified
True/False
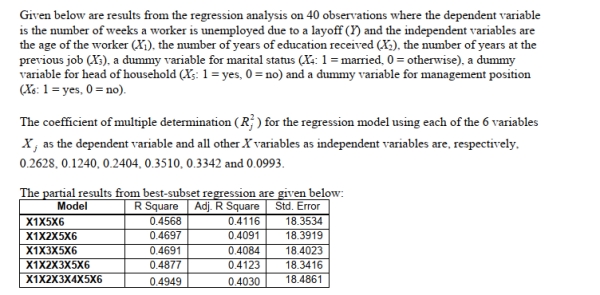
SCENARIO 15-6  -True or False: Referring to Scenario 15-6, the variable
  should be dropped to remove
collinearity?
Correct Answer

verified
Correct Answer
verified
True/False
True or False: The Variance Inflationary Factor (VIF)measures the correlation of the X variables with the Y variable.
Correct Answer

verified
Correct Answer
verified
Multiple Choice
SCENARIO 15-2 ![]()
-![]()
Correct Answer

verified
Correct Answer
verified
True/False
Correct Answer

verified
Correct Answer
verified
Multiple Choice
The logarithm transformation can be used
A) to overcome violations to the autocorrelation assumption.
B) to test for possible violations to the autocorrelation assumption.
C) to change a nonlinear model into a linear model.
D) to change a linear independent variable into a nonlinear independent variable.
Correct Answer

verified
Correct Answer
verified
Multiple Choice
SCENARIO 15-4 ![]()
15-16 Multiple Regression Model Building ![]()
-![]()
Correct Answer

verified
Correct Answer
verified
True/False
Correct Answer

verified
Correct Answer
verified
True/False
Correct Answer

verified
Correct Answer
verified
True/False
SCENARIO 15-6  -True or False: Referring to Scenario 15-6, there is reason to suspect collinearity between some
pairs of predictors based on the values of the variance inflationary factor.
Correct Answer

verified
Correct Answer
verified
True/False
True or False: One of the consequences of collinearity in multiple regression is inflated standard errors in some or all of the estimated slope coefficients.
Correct Answer

verified
Correct Answer
verified
Multiple Choice
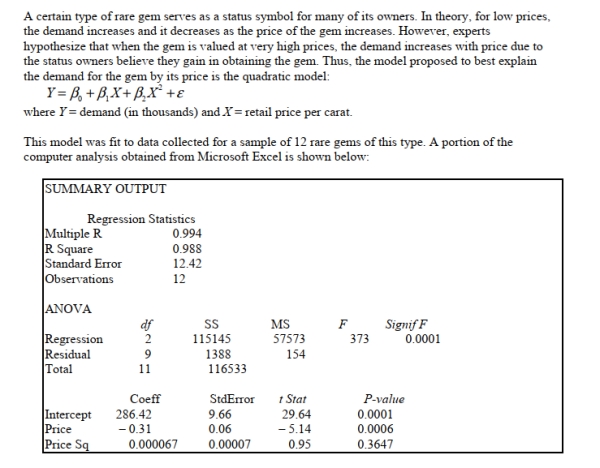
SCENARIO 15-1  -Referring to Scenario 15-1, what is the correct interpretation of the coefficient of multiple
Determination?
A) 98.8% of the total variation in demand can be explained by the linear relationship between demand and price.
B) 98.8% of the total variation in demand can be explained by the quadratic relationship between demand and price.
C) 98.8% of the total variation in demand can be explained by the addition of the square term in price.
D) 98.8% of the total variation in demand can be explained by just the square term in price.
Correct Answer

verified
Correct Answer
verified
True/False
True or False: Two simple regression models were used to predict a single dependent variable. Both models were highly significant, but when the two independent variables were placed in the same multiple regression model for the dependent variable, R2 did not increase substantially and the parameter estimates for the model were not significantly different from 0.This is probably an example of collinearity.
Correct Answer

verified
Correct Answer
verified
True/False
SCENARIO 15-1  -True or False: Referring to Scenario 15-1, a more parsimonious simple linear model is likely to
be statistically superior to the fitted curvilinear for predicting sale price (Y).
Correct Answer

verified
Correct Answer
verified
Multiple Choice
SCENARIO 15-1  -Referring to Scenario 15-1, what is the p-value associated with the test statistic for testing
Whether there is an upward curvature in the response curve relating the demand (Y) and the price
(X) ?
A) 0.0001
B) 0.0006
C) 0.3647
D) None of the above.
Correct Answer

verified
Correct Answer
verified
True/False
Correct Answer

verified
Correct Answer
verified
Multiple Choice
The Cp statistic is used
A) to determine if there is a problem of collinearity.
B) if the variances of the error terms are all the same in a regression model.
C) to choose the best model.
D) to determine if there is an irregular component in a time series.
Correct Answer

verified
Correct Answer
verified
Showing 41 - 60 of 62
Related Exams