Correct Answer

verified
2 modes: 1...View Answer
Show Answer
Correct Answer
verified
View Answer
Multiple Choice
The mean of the following is: 14, 8, 3, 8, 5
A) 7.2
B) 7.1
C) 7.4
D) 7.5
E) None of these
Correct Answer

verified
Correct Answer
verified
Short Answer
Today, a new Ford costs $24,000. In 1970, the car cost $6,000. What is the price relative?
Correct Answer

verified
Correct Answer
verified
Short Answer
Abby McDonald took five three-credit courses at Glenn Community College. She received a C in Accounting and 4 B's (Management, Logic, Algebra, and Business Law). What is her grade point average? (Assume A = 4, B = 3, C = 2.)
Correct Answer

verified
Correct Answer
verified
Short Answer
This semester Alice Front took four three-credit courses at North Shore Community College. She received an A in Business Math and C's in History, Computers, and Accounting. What is her cumulative grade point average (assume A = 4, B = 3, C = 2) to the nearest hundredth?
Correct Answer

verified
Correct Answer
verified
Short Answer
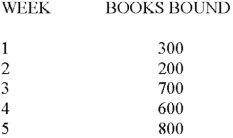
Paula's Printing Company produced the following number of bound books during the first five weeks of last year:  Prepare a bar graph.
Correct Answer

verified
Correct Answer
verified
True/False
360 represents 100% of a circle graph.
Correct Answer

verified
Correct Answer
verified
Multiple Choice
The range of 105, 108, 117, 122, 129, and 129 is:
A) 129
B) 117
C) 122
D) 24
Correct Answer

verified
Correct Answer
verified
Short Answer
Calculate the grade point average: A = 4, B = 3, C = 2, D = 1, F = 0. 
Correct Answer

verified
Correct Answer
verified
Short Answer
Find the (A) mean, (B) median, and (C) mode: 18 25 16 29 38 18
Correct Answer

verified
A. 24, B. ...View Answer
Show Answer
Correct Answer
verified
View Answer
True/False
The height of a bar chart represents the frequency.
Correct Answer

verified
Correct Answer
verified
Multiple Choice
Which is incorrect?
A) The mode is a measurement that records value
B) A bar graph is the same as a line graph
C) A mean may cause distortions
D) A circle graph is based on 360
E) None of these
Correct Answer

verified
Correct Answer
verified
Multiple Choice
To avoid distortion of extreme values, a good indicator would be the:
A) Mean
B) Median
C) Weighted-mean
D) Mode
E) None of these
Correct Answer

verified
Correct Answer
verified
True/False
A frequency distribution tries to avoid organizing numbers to show what patterns exist.
Correct Answer

verified
Correct Answer
verified
Short Answer
Given the following sales of Roe Co., prepare a line graph (run sales to $50,000 in increments of $10,000): 
Correct Answer

verified
Correct Answer
verified
True/False
The median is a better indicator than the mean.
Correct Answer

verified
Correct Answer
verified
Short Answer
At the college bookstore, the following sales were rung up. Based on this, prepare a bar graph. Use intervals of 0-$5.99, $6.00-$11.99, $12.00-$17.99, and $18.00-$23.99.
Correct Answer

verified
Correct Answer
verified
True/False
If all values are different, there is no mode.
Correct Answer

verified
Correct Answer
verified
True/False
Bar charts are nonvisual presentations of data.
Correct Answer

verified
Correct Answer
verified
Multiple Choice
9.1% of a circle graph represents
A) 32.76
B) 37.26
C) 42
D) 45
E) None of these
Correct Answer

verified
Correct Answer
verified
Showing 21 - 40 of 76
Related Exams