Filters
Question type

Study Flashcards

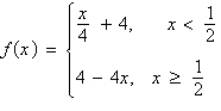
Graph the function and determine the interval(s) for which f (x) ³ 0. Graph the function and determine the interval(s)  for which f (x)  ³ 0.     A)    B)    C)    D)    E)   Graph the function and determine the interval(s)  for which f (x)  ³ 0.     A)    B)    C)    D)    E)


A) Graph the function and determine the interval(s)  for which f (x)  ³ 0.     A)    B)    C)    D)    E)
B) Graph the function and determine the interval(s)  for which f (x)  ³ 0.     A)    B)    C)    D)    E)
C) Graph the function and determine the interval(s)  for which f (x)  ³ 0.     A)    B)    C)    D)    E)
D) Graph the function and determine the interval(s)  for which f (x)  ³ 0.     A)    B)    C)    D)    E)
E) Graph the function and determine the interval(s)  for which f (x)  ³ 0.     A)    B)    C)    D)    E)

Correct Answer

verifed

verified

Which graph represents the function? Which graph represents the function?   A)    B)    C)    D)    E)


A) Which graph represents the function?   A)    B)    C)    D)    E)
B) Which graph represents the function?   A)    B)    C)    D)    E)
C) Which graph represents the function?   A)    B)    C)    D)    E)
D) Which graph represents the function?   A)    B)    C)    D)    E)
E) Which graph represents the function?   A)    B)    C)    D)    E)

Correct Answer

verifed

verified

E

Which set of ordered pairs represents a function from P to Q? Which set of ordered pairs represents a function from P to Q?     A)    B)    C)    D)    E)   Which set of ordered pairs represents a function from P to Q?     A)    B)    C)    D)    E)


A) Which set of ordered pairs represents a function from P to Q?     A)    B)    C)    D)    E)
B) Which set of ordered pairs represents a function from P to Q?     A)    B)    C)    D)    E)
C) Which set of ordered pairs represents a function from P to Q?     A)    B)    C)    D)    E)
D) Which set of ordered pairs represents a function from P to Q?     A)    B)    C)    D)    E)
E) Which set of ordered pairs represents a function from P to Q?     A)    B)    C)    D)    E)

Correct Answer

verifed

verified

Does the table describe a function? Does the table describe a function?   A)  no B)  yes


A) no
B) yes

Correct Answer

verifed

verified

Write the slope-intercept form of the equation of the line through the given point perpendicular to the given line. point: (-7, -8) line: -9x - 45y = 9


A) Write the slope-intercept form of the equation of the line through the given point perpendicular to the given line. point: (-7, -8)  line: -9x - 45y = 9 A)    B)    C)    D)    E)
B) Write the slope-intercept form of the equation of the line through the given point perpendicular to the given line. point: (-7, -8)  line: -9x - 45y = 9 A)    B)    C)    D)    E)
C) Write the slope-intercept form of the equation of the line through the given point perpendicular to the given line. point: (-7, -8)  line: -9x - 45y = 9 A)    B)    C)    D)    E)
D) Write the slope-intercept form of the equation of the line through the given point perpendicular to the given line. point: (-7, -8)  line: -9x - 45y = 9 A)    B)    C)    D)    E)
E) Write the slope-intercept form of the equation of the line through the given point perpendicular to the given line. point: (-7, -8)  line: -9x - 45y = 9 A)    B)    C)    D)    E)

Correct Answer

verifed

verified

Use a graphing utility to graph the function and find the zeroes of the function. Use a graphing utility to graph the function and find the zeroes of the function.   A)    B)    C)    D)  no real zeroes E)


A) Use a graphing utility to graph the function and find the zeroes of the function.   A)    B)    C)    D)  no real zeroes E)
B) Use a graphing utility to graph the function and find the zeroes of the function.   A)    B)    C)    D)  no real zeroes E)
C) Use a graphing utility to graph the function and find the zeroes of the function.   A)    B)    C)    D)  no real zeroes E)
D) no real zeroes
E) Use a graphing utility to graph the function and find the zeroes of the function.   A)    B)    C)    D)  no real zeroes E)

Correct Answer

verifed

verified

Describe the sequence of transformations from the related common function Describe the sequence of transformations from the related common function   to g.   A)  vertical shift 4 units up; then vertical shrink by a factor of 4 B)  horizontal shift 4 units left; then vertical shrink by a factor of 4 C)  horizontal shift 4 units right; then vertical stretch by a factor of 4 D)  vertical shift 4 units down; then vertical shrink by a factor of 4 E)  horizontal shift 4 units left; then vertical stretch by a factor of 4 to g. Describe the sequence of transformations from the related common function   to g.   A)  vertical shift 4 units up; then vertical shrink by a factor of 4 B)  horizontal shift 4 units left; then vertical shrink by a factor of 4 C)  horizontal shift 4 units right; then vertical stretch by a factor of 4 D)  vertical shift 4 units down; then vertical shrink by a factor of 4 E)  horizontal shift 4 units left; then vertical stretch by a factor of 4


A) vertical shift 4 units up; then vertical shrink by a factor of 4
B) horizontal shift 4 units left; then vertical shrink by a factor of 4
C) horizontal shift 4 units right; then vertical stretch by a factor of 4
D) vertical shift 4 units down; then vertical shrink by a factor of 4
E) horizontal shift 4 units left; then vertical stretch by a factor of 4

Correct Answer

verifed

verified

Find Find   .     A)    B)    C)    D)    E)   . Find   .     A)    B)    C)    D)    E)   Find   .     A)    B)    C)    D)    E)


A) Find   .     A)    B)    C)    D)    E)
B) Find   .     A)    B)    C)    D)    E)
C) Find   .     A)    B)    C)    D)    E)
D) Find   .     A)    B)    C)    D)    E)
E) Find   .     A)    B)    C)    D)    E)

Correct Answer

verifed

verified

E

Use the Vertical Line Test to determine in which of the graphs y is not a function of x.


A) All of the choices (A, B, C, and D) represent functions.
B) Use the Vertical Line Test to determine in which of the graphs y is not a function of x. A)  All of the choices (A, B, C, and D)  represent functions. B)    C)    D)    E)
C) Use the Vertical Line Test to determine in which of the graphs y is not a function of x. A)  All of the choices (A, B, C, and D)  represent functions. B)    C)    D)    E)
D) Use the Vertical Line Test to determine in which of the graphs y is not a function of x. A)  All of the choices (A, B, C, and D)  represent functions. B)    C)    D)    E)
E) Use the Vertical Line Test to determine in which of the graphs y is not a function of x. A)  All of the choices (A, B, C, and D)  represent functions. B)    C)    D)    E)

Correct Answer

verifed

verified

Evaluate the indicated function for Evaluate the indicated function for   and   . ( fg ) (1)  A)  12 B)  -32 C)  -20 D)  -16 E)  -30 and Evaluate the indicated function for   and   . ( fg ) (1)  A)  12 B)  -32 C)  -20 D)  -16 E)  -30 . ( fg ) (1)


A) 12
B) -32
C) -20
D) -16
E) -30

Correct Answer

verifed

verified

Which function does the graph represent? Which function does the graph represent?   A)  g(x)  =       B)    C)  g(x)  =         D)  g(x)  =       E)  g(x)  =
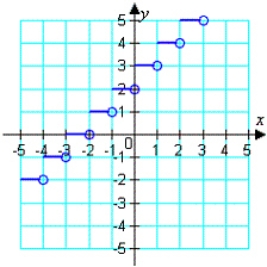

A) g(x) = Which function does the graph represent?   A)  g(x)  =       B)    C)  g(x)  =         D)  g(x)  =       E)  g(x)  =      Which function does the graph represent?   A)  g(x)  =       B)    C)  g(x)  =         D)  g(x)  =       E)  g(x)  =      Which function does the graph represent?   A)  g(x)  =       B)    C)  g(x)  =         D)  g(x)  =       E)  g(x)  =
B) Which function does the graph represent?   A)  g(x)  =       B)    C)  g(x)  =         D)  g(x)  =       E)  g(x)  =
C) g(x) = Which function does the graph represent?   A)  g(x)  =       B)    C)  g(x)  =         D)  g(x)  =       E)  g(x)  =      Which function does the graph represent?   A)  g(x)  =       B)    C)  g(x)  =         D)  g(x)  =       E)  g(x)  =      Which function does the graph represent?   A)  g(x)  =       B)    C)  g(x)  =         D)  g(x)  =       E)  g(x)  =      Which function does the graph represent?   A)  g(x)  =       B)    C)  g(x)  =         D)  g(x)  =       E)  g(x)  =
D) g(x) = Which function does the graph represent?   A)  g(x)  =       B)    C)  g(x)  =         D)  g(x)  =       E)  g(x)  =      Which function does the graph represent?   A)  g(x)  =       B)    C)  g(x)  =         D)  g(x)  =       E)  g(x)  =      Which function does the graph represent?   A)  g(x)  =       B)    C)  g(x)  =         D)  g(x)  =       E)  g(x)  =
E) g(x) = Which function does the graph represent?   A)  g(x)  =       B)    C)  g(x)  =         D)  g(x)  =       E)  g(x)  =      Which function does the graph represent?   A)  g(x)  =       B)    C)  g(x)  =         D)  g(x)  =       E)  g(x)  =      Which function does the graph represent?   A)  g(x)  =       B)    C)  g(x)  =         D)  g(x)  =       E)  g(x)  =

Correct Answer

verifed

verified

Determine whether the function is even, odd, or neither. Determine whether the function is even, odd, or neither.   A)  neither B)  even C)  odd


A) neither
B) even
C) odd

Correct Answer

verifed

verified

Does the table describe a function? Does the table describe a function?   A)  yes B)  no


A) yes
B) no

Correct Answer

verifed

verified

Which equation does not represent y as a function of x?


A) Which equation does not represent y as a function of x? A)    B)    C)    D)    E)
B) Which equation does not represent y as a function of x? A)    B)    C)    D)    E)
C) Which equation does not represent y as a function of x? A)    B)    C)    D)    E)
D) Which equation does not represent y as a function of x? A)    B)    C)    D)    E)
E) Which equation does not represent y as a function of x? A)    B)    C)    D)    E)

Correct Answer

verifed

verified

Write an equation for the function that is described by the following characteristics: the shape of Write an equation for the function that is described by the following characteristics: the shape of   , but moved eight units down, two units to the left, and then reflected in the x-axis A)    B)    C)    D)    E)   , but moved eight units down, two units to the left, and then reflected in the x-axis


A) Write an equation for the function that is described by the following characteristics: the shape of   , but moved eight units down, two units to the left, and then reflected in the x-axis A)    B)    C)    D)    E)
B) Write an equation for the function that is described by the following characteristics: the shape of   , but moved eight units down, two units to the left, and then reflected in the x-axis A)    B)    C)    D)    E)
C) Write an equation for the function that is described by the following characteristics: the shape of   , but moved eight units down, two units to the left, and then reflected in the x-axis A)    B)    C)    D)    E)
D) Write an equation for the function that is described by the following characteristics: the shape of   , but moved eight units down, two units to the left, and then reflected in the x-axis A)    B)    C)    D)    E)
E) Write an equation for the function that is described by the following characteristics: the shape of   , but moved eight units down, two units to the left, and then reflected in the x-axis A)    B)    C)    D)    E)

Correct Answer

verifed

verified

Evaluate the function at the specified value of the independent variable and simplify. Evaluate the function at the specified value of the independent variable and simplify.     A)  3.8 B)    C)    D)    E)  -6.2 Evaluate the function at the specified value of the independent variable and simplify.     A)  3.8 B)    C)    D)    E)  -6.2


A) 3.8
B) Evaluate the function at the specified value of the independent variable and simplify.     A)  3.8 B)    C)    D)    E)  -6.2
C) Evaluate the function at the specified value of the independent variable and simplify.     A)  3.8 B)    C)    D)    E)  -6.2
D) Evaluate the function at the specified value of the independent variable and simplify.     A)  3.8 B)    C)    D)    E)  -6.2
E) -6.2

Correct Answer

verifed

verified

Show algebraically that f and g are inverse functions. Show algebraically that f and g are inverse functions.       Show algebraically that f and g are inverse functions.       Show algebraically that f and g are inverse functions.

Correct Answer

verifed

verified

11eb11e8_19d2_00bf_ad38_23c014613fc9_TB4588_11 11eb11e8_19d2_00c0_ad38_47f04de71ad7_TB4588_11

Find the inverse function of f. Find the inverse function of f.   A)    B)    C)    D)    E)


A) Find the inverse function of f.   A)    B)    C)    D)    E)
B) Find the inverse function of f.   A)    B)    C)    D)    E)
C) Find the inverse function of f.   A)    B)    C)    D)    E)
D) Find the inverse function of f.   A)    B)    C)    D)    E)
E) Find the inverse function of f.   A)    B)    C)    D)    E)

Correct Answer

verifed

verified

Write the linear function f such that it has the indicated values. Write the linear function f such that it has the indicated values.   A)    B)    C)    D)    E)


A) Write the linear function f such that it has the indicated values.   A)    B)    C)    D)    E)
B) Write the linear function f such that it has the indicated values.   A)    B)    C)    D)    E)
C) Write the linear function f such that it has the indicated values.   A)    B)    C)    D)    E)
D) Write the linear function f such that it has the indicated values.   A)    B)    C)    D)    E)
E) Write the linear function f such that it has the indicated values.   A)    B)    C)    D)    E)

Correct Answer

verifed

verified

Use a graphing utility to graph the function and visually determine the intervals over which the function is increasing, decreasing, or constant. Use a graphing utility to graph the function and visually determine the intervals over which the function is increasing, decreasing, or constant.   A)    B)    C)    D)    E)


A) Use a graphing utility to graph the function and visually determine the intervals over which the function is increasing, decreasing, or constant.   A)    B)    C)    D)    E)
B) Use a graphing utility to graph the function and visually determine the intervals over which the function is increasing, decreasing, or constant.   A)    B)    C)    D)    E)
C) Use a graphing utility to graph the function and visually determine the intervals over which the function is increasing, decreasing, or constant.   A)    B)    C)    D)    E)
D) Use a graphing utility to graph the function and visually determine the intervals over which the function is increasing, decreasing, or constant.   A)    B)    C)    D)    E)
E) Use a graphing utility to graph the function and visually determine the intervals over which the function is increasing, decreasing, or constant.   A)    B)    C)    D)    E)

Correct Answer

verifed

verified

Showing 1 - 20 of 52

Related Exams

Show Answer