A) A decrease in the supply of beef
B) An increase in family incomes
C) An increase in the price of feed grains for cattle
D) A decrease in the price of pork
Correct Answer

verified
Correct Answer
verified
True/False
An increase in demand causes equilibrium price and quantity to rise, other things constant.
Correct Answer

verified
Correct Answer
verified
Multiple Choice
The law of supply states that, other things equal, as the price of a good goes:
A) up, the quantity supplied goes up.
B) up, the supply goes down.
C) down, the quantity supplied goes up.
D) down, the supply goes down.
Correct Answer

verified
Correct Answer
verified
Multiple Choice
Suppose OPEC oil cartel announces that it will increase production of oil. Using supply and demand analysis to predict the effect of increased production on equilibrium price and quantity, the first step is to show the:
A) demand curve shifting to the right.
B) demand curve shifting to the left.
C) supply curve shifting to the right.
D) supply curve shifting to the left.
Correct Answer

verified
Correct Answer
verified
Multiple Choice
Refer to the graphs showing the demand for music downloads. The effect of an increase in the price of music downloads on consumers is best shown by arrow: 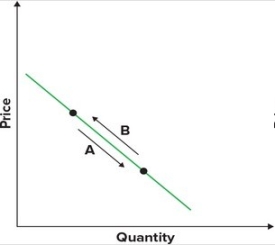
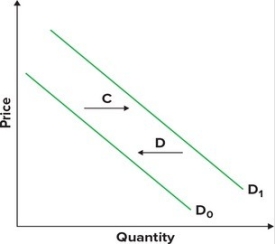
A) A.
B) B.
C) C.
D) D.
Correct Answer

verified
Correct Answer
verified
Multiple Choice
The following graph shows the supply of movie downloads. At a price of $4.00, what is the quantity supplied by each of the producers? 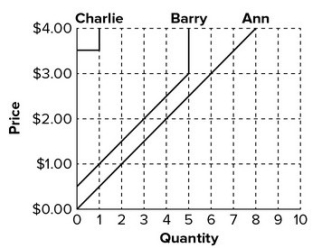
A) Charlie: 4, Barry: 5, Ann: 15 movies per week
B) Charlie: 0, Barry: 4, Ann: 14 movies per week
C) Charlie: 1, Barry: 5, Ann: 8 movies per week
D) Charlie: 3, Barry: 6, Ann: 7 movies per week
Correct Answer

verified
Correct Answer
verified
Multiple Choice
Moore's Law states that the processing power of the latest computer chips doubles about every eighteen months. Assuming the graphs demonstrate the market for the latest computer chips, which of the following diagrams describe this situation? 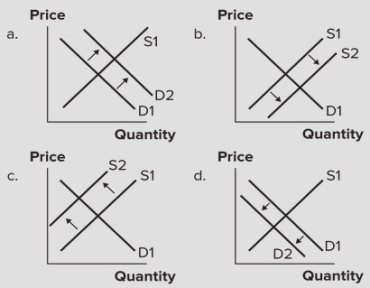
A) Graph a
B) Graph b
C) Graph c
D) Graph d
Correct Answer

verified
Correct Answer
verified
Multiple Choice
Refer to the graphs shown. If the quantity demanded by consumers is the same for every price, then the demand curve would look like: 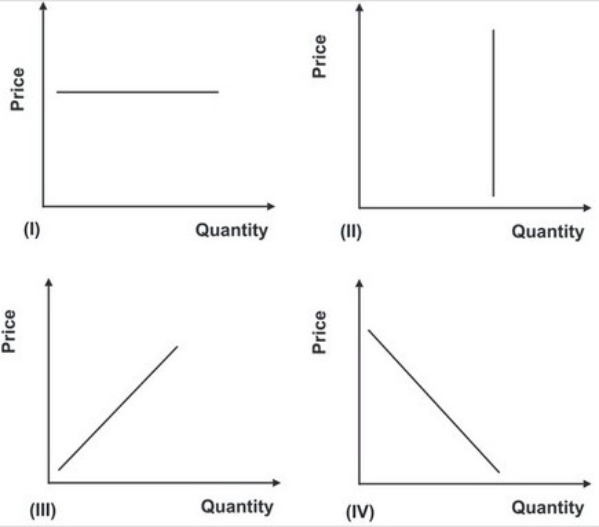
A) I.
B) II.
C) III.
D) IV.
Correct Answer

verified
Correct Answer
verified
Multiple Choice
Suppose that the table shown shows the demand and supply schedules for pork bellies. There is a shortage of 15,000 pounds at a price of:
A) $0.25.
B) $0.50.
C) $0.75.
D) $0.95.
Correct Answer

verified
Correct Answer
verified
Multiple Choice
Refer to the graphs shown. If consumers began purchasing more of this product due to a decrease in price, this would be shown by arrow: 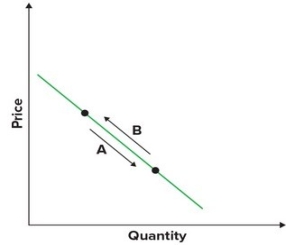
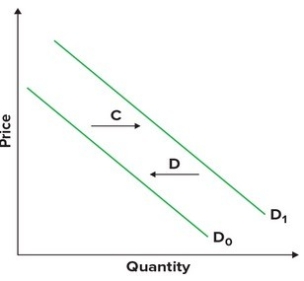
A) A.
B) B.
C) C.
D) D.
Correct Answer

verified
Correct Answer
verified
Multiple Choice
In Operation Desert Storm, oil facilities in Iraq were attacked amid strong demand for oil. In response, political pressure motivated OPEC to increase the daily quota by 2 million barrels a day. Assuming demand did not change, which of the following series of prices most likely matches how the price of a barrel of oil changed from (1) before the attack, to (2) just after the attack, to (3) after OPEC increased the quota?
A) $42, $38, $40
B) $38, $40, $42
C) $42, $40, $38
D) $40, $42, $38
Correct Answer

verified
Correct Answer
verified
Showing 141 - 151 of 151
Related Exams