A) fall from 12 to 4.
B) fall from 12 to 8.
C) rise from 12 to 13.
D) be unchanged at 12.
Correct Answer

verified
Correct Answer
verified
Multiple Choice
Suppose elasticity of demand is 1, elasticity of supply is 2, and a 5 percent excise tax is levied on consumers. Which of the following changes will reduce the burden of the tax on consumers?
A) Elasticity of demand falls to 0.
B) Elasticity of demand rises to 2.
C) Taxing authorities levy the tax on suppliers.
D) Nothing will change the burden of the tax.
Correct Answer

verified
Correct Answer
verified
Multiple Choice
Refer to the graph shown. An effective price floor at Pf imposes a deadweight loss shown by: 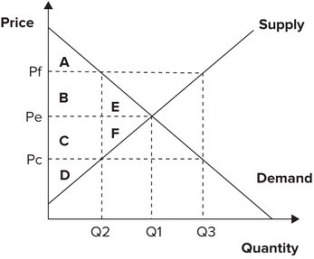
A) rectangles B and C.
B) rectangles A and D.
C) triangles E and F.
D) rectangle B and triangle E.
Correct Answer

verified
Correct Answer
verified
Multiple Choice
Total consumer surplus is measured as the area:
A) between the demand curve and the supply curve.
B) above the demand curve.
C) beneath the demand curve and above the market price.
D) beneath the market price and above the supply curve.
Correct Answer

verified
Correct Answer
verified
Multiple Choice
Assuming a binding price floor, the more inelastic the supply and the demand curves are, the:
A) smaller the shortage a price floor will create.
B) greater the shortage a price floor will create.
C) smaller the surplus a price floor will create.
D) greater the surplus a price floor will create.
Correct Answer

verified
Correct Answer
verified
Multiple Choice
Refer to the following graph. 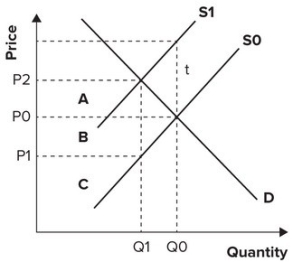 Given a tax of t on suppliers, revenue collected is:
A) A, B, C. Suppliers pay A and B. Consumers pay C.
B) A, B, C. Suppliers pay B and C. Consumers pay A.
C) A and B. Suppliers pay A. Consumers pay B.
D) A and B. Suppliers pay B. Consumers pay A.
Correct Answer

verified
Correct Answer
verified
True/False
An excise tax on alcohol causes the supply of alcohol to decrease and the price of alcohol to decrease.
Correct Answer

verified
Correct Answer
verified
Multiple Choice
Refer to the graph shown. Assume that the market is initially in equilibrium at a price of $6 and a quantity of 40 units. If the government imposes a $2 per-unit tax on this product, equilibrium quantity will change to: 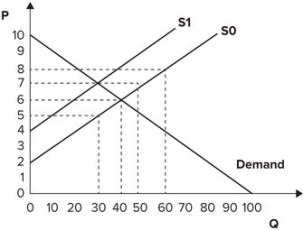
A) 30.
B) 50.
C) 60.
D) 100.
Correct Answer

verified
Correct Answer
verified
Multiple Choice
If the supply curve is perfectly inelastic, the burden of a tax on suppliers is borne:
A) entirely by the suppliers.
B) entirely by the consumers.
C) mostly by the suppliers and partly by the consumers if the demand curve is inelastic.
D) partly by the suppliers and mostly by the consumers if the demand curve is elastic.
Correct Answer

verified
Correct Answer
verified
Multiple Choice
Refer to the graph shown. With an effective price ceiling at Pc, the effect is an implicit tax on: 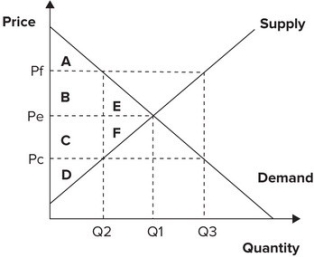
A) suppliers of area C and a subsidy to consumers of that area.
B) suppliers of area D and a subsidy to consumers of that area.
C) consumers of area C and a subsidy to suppliers of that area.
D) consumers of area D and a subsidy to suppliers of that area.
Correct Answer

verified
Correct Answer
verified
Multiple Choice
Refer to the graph shown. An effective price floor at $8 imposes a deadweight loss of: 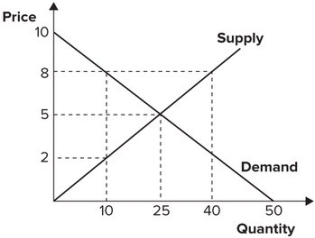
A) 25.
B) 45.
C) 90.
D) 100.
Correct Answer

verified
Correct Answer
verified
Multiple Choice
Rent-seeking activities:
A) require resources, and the net result is to reduce total welfare to society.
B) require resources, but the net result is to increase total welfare to society.
C) do not require resources.
D) have no effect on society's welfare.
Correct Answer

verified
Correct Answer
verified
Multiple Choice
If price is lowered by law from the market equilibrium value of $5 to a lower value of $4:
A) both producer surplus and consumer surplus will increase.
B) consumer surplus will decrease and there will be some total surplus lost.
C) producer surplus will decrease and there will be some total surplus lost.
D) there will be lost surplus, as both producer surplus and consumer surplus decrease.
Correct Answer

verified
Correct Answer
verified
Multiple Choice
Refer to the graph shown. When the market is in equilibrium, consumer surplus is equal to: 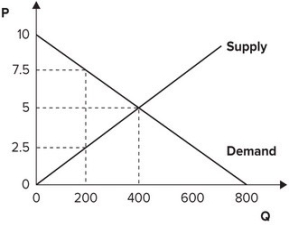
A) 500.
B) 1,000.
C) 1,500.
D) 2,000.
Correct Answer

verified
Correct Answer
verified
Multiple Choice
Refer to the graph shown. An effective price floor at Pf causes consumer surplus to: 
A) change from areas C + D + F to areas B + C + D.
B) change from areas A + B + E to areas A + B + C.
C) fall from areas C + D + F to area D.
D) fall from areas A + B + E to area A.
Correct Answer

verified
Correct Answer
verified
Multiple Choice
Refer to the graph shown. With an effective price ceiling at Pc, total surplus is reduced by: 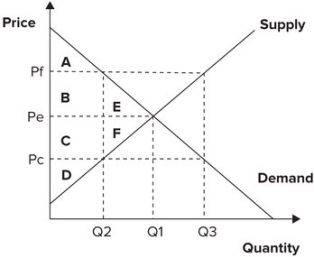
A) rectangles B and C.
B) rectangles A and D.
C) triangles E and F.
D) rectangle B and triangle E.
Correct Answer

verified
Correct Answer
verified
Multiple Choice
Refer to the graph shown. An effective price ceiling at $3 imposes a deadweight loss of: 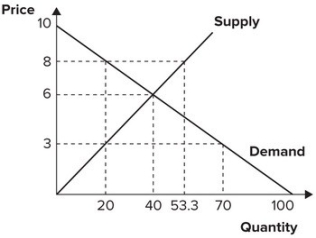
A) 20.
B) 30.
C) 50.
D) 100.
Correct Answer

verified
Correct Answer
verified
Multiple Choice
Refer to the graph shown. The segment of the demand curve between the initial equilibrium price of $5.00 and the new equilibrium price of $3.00 is: 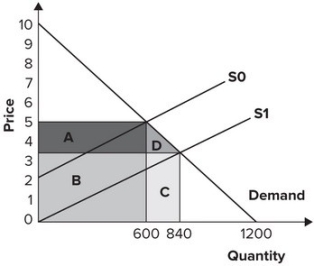
A) elastic.
B) inelastic.
C) perfectly elastic.
D) perfectly inelastic.
Correct Answer

verified
Correct Answer
verified
Multiple Choice
Refer to the graph shown. Assume the market is initially in equilibrium at point b in the graph but the imposition of a per-unit tax on this product shifts the supply curve up from S0 to S1. The amount of revenue government will collect from this tax is equal to the: 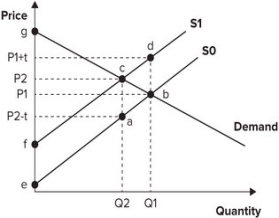
A) amount of the per-unit tax multiplied by Q1.
B) amount of the per-unit tax multiplied by Q2.
C) area of the triangle abc.
D) area of the triangle bcd.
Correct Answer

verified
Correct Answer
verified
Multiple Choice
Refer to the graph shown. Assume the market is initially in equilibrium at point j in the graph but the imposition of a per-unit tax on this product shifts the supply curve up from S0 to S1. The lost producer surplus of this tax is equal to the area: 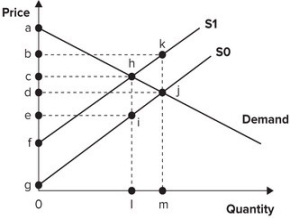
A) cdjh.
B) deij.
C) hji.
D) khj.
Correct Answer

verified
Correct Answer
verified
Showing 121 - 140 of 169
Related Exams