A) leftward shift of the demand curve.
B) rightward shift of the demand curve.
C) movement upward and to the left along the demand curve.
D) movement downward and to the right along the demand curve.
Correct Answer

verified
Correct Answer
verified
Multiple Choice
If an effective ceiling price is placed on gasoline then:
A) the quantity demanded will exceed the quantity supplied.
B) the ceiling price will be below the equilibrium price.
C) the federal government must establish some formal system for rationing it to consumers.
D) all of the above are likely outcomes.
Correct Answer

verified
Correct Answer
verified
Multiple Choice
Immigration to Canada from many parts of the world has increased the demand for a whole range of ethnic goods and services, particularly in:
A) Southern Ontario and British Columbia.
B) Alberta and Quebec.
C) Newfoundland and Nova Scotia.
D) New Brunswick and Quebec.
Correct Answer

verified
Correct Answer
verified
Multiple Choice
When the price of a product falls, the purchasing power of our money income rises and thus permits us to purchase more of the product.This statement describes:
A) an inferior good.
B) the rationing function of prices.
C) the substitution effect.
D) the income effect.
Correct Answer

verified
Correct Answer
verified
True/False
A price fixed below the equilibrium price of a product will cause a shortage of that product.
Correct Answer

verified
Correct Answer
verified
Multiple Choice
A headline reads "Lumber Prices Up Sharply." In a competitive market, this situation would lead to a(n) :
A) increase in the price and quantity of new homes.
B) decrease in the price and quantity of new homes.
C) increase in the price of new homes and a decrease in the quantity of new homes.
D) decrease in the price of new homes and an increase in the quantity of new homes.
Correct Answer

verified
Correct Answer
verified
Multiple Choice
Graphically, the market supply curve is:
A) steeper than any individual producer's supply curve which comprises it.
B) greater than the sum of the individual producers' supply curves.
C) the horizontal sum of individual producers' supply curves.
D) the vertical sum of individual producers' supply curves.
Correct Answer

verified
Correct Answer
verified
Multiple Choice
If two goods are close substitutes:
A) consumers will always buy the one that has the highest price.
B) a fall in the price of one will decrease the demand for the other.
C) an increase in the price of one causes the demand for the other to decrease.
D) a decrease in the price of one causes an increase in the demand for the other.
Correct Answer

verified
Correct Answer
verified
Multiple Choice
Superstar rock singers may set concert ticket prices below the equilibrium level because:
A) it is too costly to estimate the equilibrium price.
B) equilibrium ticket prices would be illegal.
C) it lowers their gross income which has consequent tax advantages.
D) the behaviour of fans in attempting to get tickets generates publicity and sold-out concerts promote record sales.
Correct Answer

verified
Correct Answer
verified
Multiple Choice
What combination of changes would most likely decrease the equilibrium quantity?
A) when supply increases and demand decreases
B) when demand increases and supply decreases
C) when demand decreases and supply decreases
D) when supply increases and demand increases
Correct Answer

verified
Correct Answer
verified
Multiple Choice
What is the likely effect on the market for wine of a simultaneous increase in both consumer incomes and producer taxes on wine?
A) an increase in both price and quantity
B) an increase in price and a decrease in output
C) a decrease in price and an indeterminate effect on quantity
D) an increase in price and an indeterminate effect on quantity
Correct Answer

verified
Correct Answer
verified
Multiple Choice
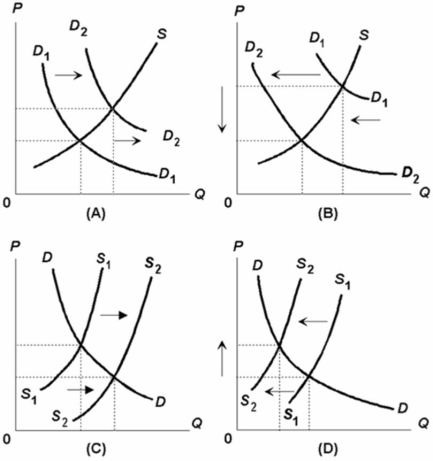
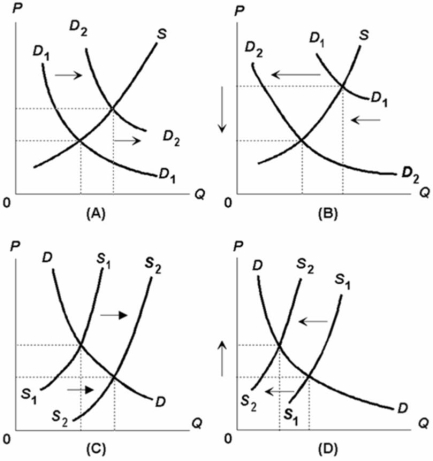
 If peanut butter and grape jelly are complementary products, which diagram above illustrates the effect on the peanut butter market as a result of a decrease in the price of grape jelly?
A) A
B) B
C) C
D) D
Correct Answer

verified
Correct Answer
verified
Multiple Choice
When economists say that the demand for a product has increased, they mean that:
A) consumers are now willing to purchase more of this product at each possible price.
B) the product has become particularly scarce for some reason.
C) the product price has fallen and as a consequence consumers are buying a larger quantity of the product.
D) the demand curve has shifted to the left.
Correct Answer

verified
Correct Answer
verified
Multiple Choice
The demand for commodity X is represented by the equation P = 10 - 0.2Q and supply by the equation P = 2 + 0.2Q.Refer to the above information.After the change in demand, the new equilibrium price is:
A) $2
B) $4
C) $6
D) $7
Correct Answer

verified
Correct Answer
verified
True/False
If the supply of a product decreases and demand increases, the equilibrium price and quantity will increase.
Correct Answer

verified
Correct Answer
verified
Multiple Choice
If an increase in consumer incomes causes the demand curve for product Z to shift to the left, then it can be said that product Z is a(n) :
A) normal good.
B) luxury good.
C) inferior good.
D) inexpensive good.
Correct Answer

verified
Correct Answer
verified
Multiple Choice
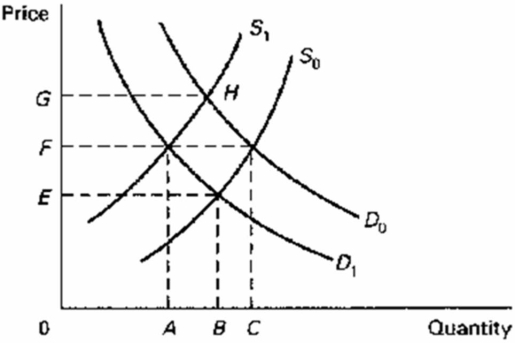
Refer to the diagram, which shows demand and supply conditions in the competitive market for product X.A shift in the demand curve from D0 to D1 might be caused by a(n) : 
A) decrease in income if X is an inferior good.
B) increase in the price of complementary good Y.
C) increase in money incomes if X is a normal good.
D) increase in the price of substitute product Y.
Correct Answer

verified
Correct Answer
verified
Multiple Choice
 Which diagram above illustrates the effects on the peanut butter market as a result of a higher wage rate for peanut workers?
A) A
B) B
C) C
D) D
Correct Answer

verified
Correct Answer
verified
Multiple Choice
If the supply and demand curves for a product both decrease, we can say that equilibrium:
A) quantity must fall and equilibrium price must rise.
B) price must fall, but equilibrium quantity may either rise, fall, or remain unchanged.
C) quantity must decline, but equilibrium price may either rise, fall, or remain unchanged.
D) quantity and equilibrium price must both decline.
Correct Answer

verified
Correct Answer
verified
True/False
The minimum wage imposes a legal floor under the wage of the least skilled worker.
Correct Answer

verified
Correct Answer
verified
Showing 121 - 140 of 291
Related Exams