A) decreases;increases.
B) decreases;decreases.
C) increases;increases.
D) increases;decreases.
Correct Answer

verified
Correct Answer
verified
Multiple Choice
Use the following to answer question: 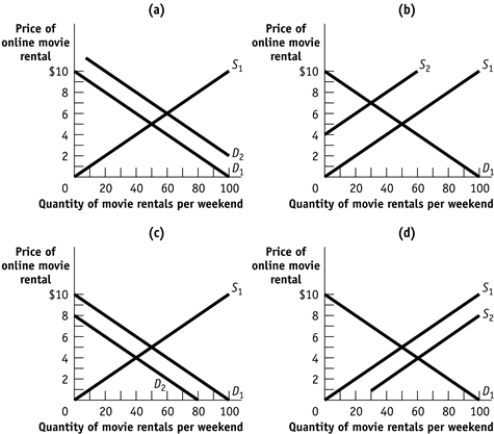 -(Figure: Four Markets for Online Movie Rentals) Use Figure: Four Markets for Online Movie Rentals.Which of the graphs shows what may happen in the market for online movie rentals if D1 or S1 is the original curve and D2 or S2 is the new curve and if the cost of buying content for online movie distributors like Apple (i.e. ,the price that Apple pays for the online content to sell to consumers) decreases?
A) A
B) B
C) C
D) D
Correct Answer

verified
Correct Answer
verified
Multiple Choice
Which factor will NOT cause an increase in demand for good X?
A) a decrease in income if good X is an inferior good
B) an increase in income if good X is a normal good
C) a decrease in the price of good X
D) an increase in the popularity of good X with consumers
Correct Answer

verified
Correct Answer
verified
Multiple Choice
Which factor would cause a DECREASE in the supply of a good?
A) a decrease in input prices
B) an increase in the number of sellers in the market
C) suppliers' expectations of higher prices in the future
D) an advancement in the technology for producing the good
Correct Answer

verified
C
Correct Answer
verified
True/False
Use the following to answer question: 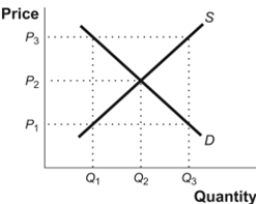 -(Figure: Supply,Demand,and Equilibrium)Use Figure: Supply,Demand,and Equilibrium.In the figure,there will be an excess supply of the good at a price of P1.
Correct Answer

verified
Correct Answer
verified
Multiple Choice
The market for corn in Kansas is considered to be competitive.This means there are _____ buyers and _____ sellers of corn in Kansas.
A) many;few
B) few;many
C) many;many
D) few;few
Correct Answer

verified
Correct Answer
verified
Multiple Choice
Use the following to answer question: 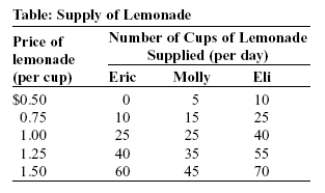 -(Table: Supply of Lemonade) Use Table: Supply of Lemonade.If the price of lemonade is $1 per cup,the total quantity of lemonade supplied will be _____ cups per day.
A) 50
B) 80
C) 25
D) 90
Correct Answer

verified
Correct Answer
verified
Multiple Choice
Use the following to answer question: 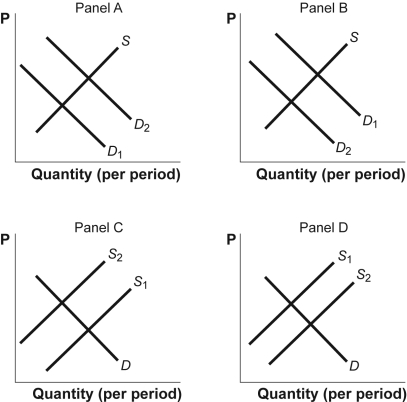 -(Figure: Shifts in Demand and Supply II) Use Figure: Shifts in Demand and Supply II.The figure shows how supply and demand might shift in response to specific events.Suppose the birthrate decreases.Which panel BEST describes how this will affect the market for diapers?
A) Panel A
B) Panel B
C) Panel C
D) Panel D
Correct Answer

verified
Correct Answer
verified
Multiple Choice
If suppliers expect prices for their product to rise next year,then one would expect a:
A) shift in the demand curve for the product this year.
B) decrease in the quantity demanded this year.
C) shift to the left in the supply curve for the product this year.
D) shift to the right in the supply curve for the product this year.
Correct Answer

verified
Correct Answer
verified
Multiple Choice
Use the following to answer question: 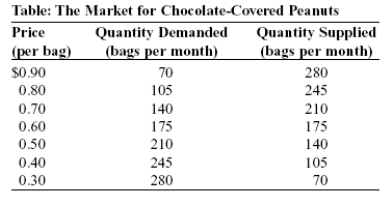 -(Table: The Market for Chocolate-Covered Peanuts) Use Table: The Market for Chocolate-Covered Peanuts.If the price of chocolate-covered peanuts is $0.60,the price will:
A) not change.
B) fall to $0.30.
C) fall to $0.50.
D) rise to $0.70.
Correct Answer

verified
Correct Answer
verified
Multiple Choice
Use the following to answer question: 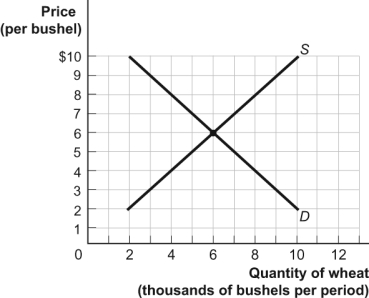 -(Figure: The Demand and Supply of Wheat) Use Figure: The Demand and Supply of Wheat.What is the equilibrium quantity in this wheat market each period?
A) 12,000 bushels
B) 2,000 bushels
C) 10,000 bushels
D) 6,000 bushels
Correct Answer

verified
Correct Answer
verified
Multiple Choice
Milk is an important ingredient in the production of ice cream.If the price of milk increases,then one would expect,holding all other things constant:
A) the supply curve for ice cream to shift left.
B) the supply curve for ice cream to shift right.
C) no change in the supply curve for ice cream.
D) a movement along the supply curve for ice cream curve,resulting in more ice cream supplied.
Correct Answer

verified
Correct Answer
verified
Multiple Choice
A negative relationship between quantity demanded and price is called the law of:
A) demand.
B) increasing returns.
C) market clearing.
D) supply.
Correct Answer

verified
Correct Answer
verified
Multiple Choice
Use the following to answer question:  -(Figure: The Demand and Supply of Wheat) Use Figure: The Demand and Supply of Wheat.A temporary price of $2 in this market would result in a _____ of _____ bushels per period.
A) surplus;4,000
B) shortage;8,000
C) shortage;10,000
D) surplus;10,000
Correct Answer

verified
Correct Answer
verified
Multiple Choice
If the quantity of housing supplied in a community is greater than the quantity of houses demanded,the existing price:
A) is above the market equilibrium price.
B) will rise to clear the market.
C) will either rise or remain unchanged.
D) is below the market equilibrium price.
Correct Answer

verified
A
Correct Answer
verified
Multiple Choice
If Benjamin considers sushi to be a normal good and if his income increases by 20%,his purchases of sushi will:
A) decrease by 20%.
B) increase.
C) decrease.
D) not change.
Correct Answer

verified
Correct Answer
verified
Multiple Choice
If demand is downward sloping,an increase in supply with no change in demand will lead to a(n) _____ in equilibrium quantity and a(n) _____ in equilibrium price.
A) increase;increase
B) increase;decrease
C) decrease;increase
D) decrease;decrease
Correct Answer

verified
B
Correct Answer
verified
Multiple Choice
Customers used to pay inside before pumping gas.When gas stations introduced paying at the pump,thus decreasing production costs,there was a shift to the _____ in the _____ curve and gas prices _____.
A) right;supply;decreased
B) left;supply;increased
C) right;demand;increased
D) left;demand;decreased
Correct Answer

verified
Correct Answer
verified
Multiple Choice
The market for milk is initially in equilibrium.Milk producers successfully advertise to encourage milk drinking.At the same time,more milk producers enter the market.Standard demand and supply analysis tells us that the:
A) equilibrium price and quantity of milk will rise.
B) equilibrium price and quantity of milk will fall.
C) equilibrium quantity of milk will rise,but we can't determine how the equilibrium price will be affected.
D) equilibrium price of milk will rise,but we can't determine how the equilibrium quantity will be affected.
Correct Answer

verified
Correct Answer
verified
Multiple Choice
Use the following to answer question:  -(Figure: Shifts in Demand and Supply II) Use Figure: Shifts in Demand and Supply II.The graph shows how supply and demand might shift in response to specific events.Suppose a fall frost destroys one-third of the nation's grapefruit crop.Which panel BEST describes how this will affect the market for vitamin B12 tablets,which are a substitute in consumption for grapefruit?
A) Panel A
B) Panel B
C) Panel C
D) Panel D
Correct Answer

verified
Correct Answer
verified
Showing 1 - 20 of 265
Related Exams